
The Leading Customer Data Infrastructure (CDI) for Retail Businesses
Snowplow’s customer data infrastructure (CDI) empowers retail companies with high-quality event-level data in real time, enabling them to gain a deep understanding of their customers , deliver hyper-personalized experiences, and make better commercial decisions.


Drive Growth with Detailed Ecommerce Analytics
Snowplow delivers high-quality behavioral data fast enough to power real-time, in-session personalization, enabling your product and engineering teams to deliver adaptive shopping experiences without building complex infrastructure from scratch. Use Snowplow data to deliver in-session product recommendations, dynamic pricing, adaptive user experiences based on browsing behavior, contextual assistance from AI shopping assistants. Drive significant uplift in conversion rates, average order value, and customer lifetime value.
Ship Personalized Shopping Experiences in Weeks, Not Years
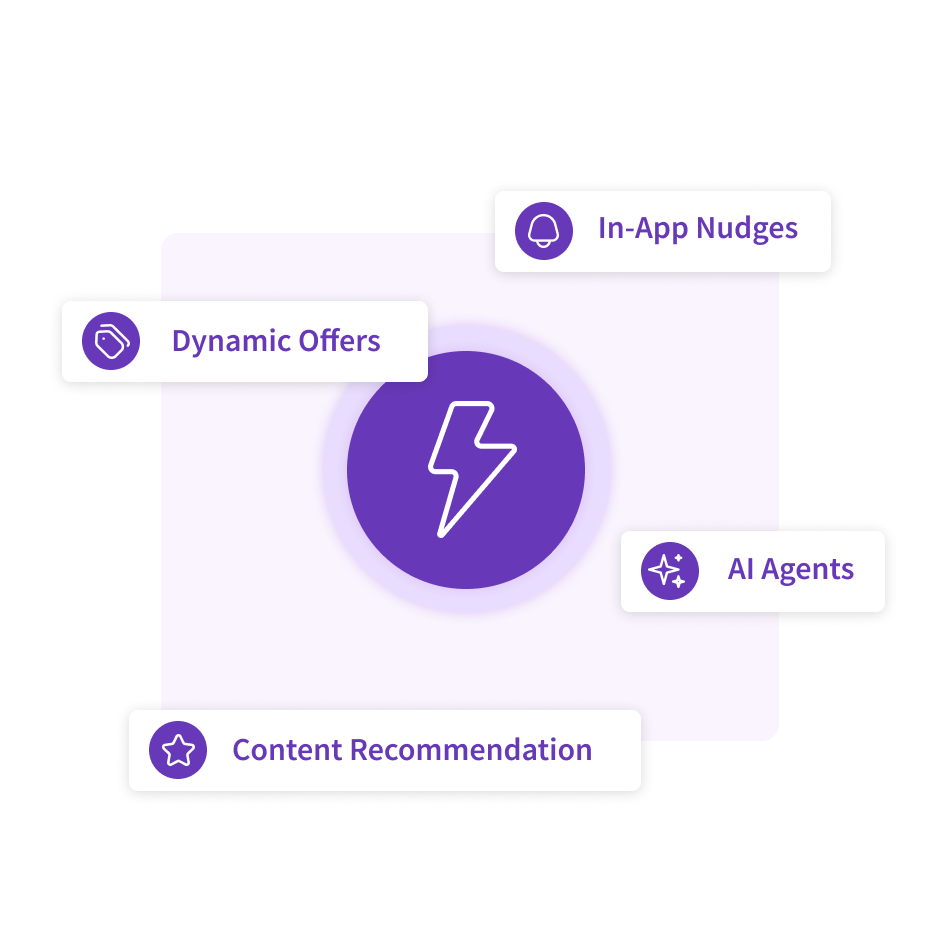
Retail and ecommerce product teams are racing to deliver Netflix-level personalization like adaptive interfaces, intelligent recommendations, and AI-powered shopping assistants, but building the real-time infrastructure to power these experiences can consume 18-24 months of engineering effort. Snowplow Signals provides production-ready infrastructure that computes and serves real-time customer context in milliseconds, enabling teams to deliver these personalized experiences at scale, without the engineering overhead; all running natively in your cloud environment with the same data quality, governance, and control you already have with Snowplow CDI.

Automate Your Marketing with Behavioral Data
Snowplow enables you to get an incredibly detailed view of customer behavior, and use the behavioral data collected to drive real-time marketing automation. Snowplow’s data powers use cases such as live customer journey nudges and triggered email campaigns, designed to maximize conversions.

Improve Your Marketing ROI with Custom Attribution Models
By accurately attributing marketing leads to campaigns, channels, and platforms, you can optimize marketing budgets and drive revenue growth. Snowplow enables custom attribution models by capturing whatever behavioral data you need across multiple touch points, and delivering it in a single, consolidated format.
Learn more about marketing attribution

Optimize Your Supply Chain
Supply chain optimization can translate into huge cost savings. Snowplow’s range of server side trackers let you monitor actions such as dispatches, deliveries, and more. Collecting supply chain data alongside your conversion data means you can centralize data from multiple systems in one place for a more complete view of your business.


