
Where does behavioral data come from?
Behavioral data describes interactions with customers, partners, and your applications and systems, to form a clear picture of your business. This data can come from across your digital estate (website, app, IoT, server-side apps, infrastructure, CRM, and more) or physical estate (store, in-home), typically as rows of events. Each event contains entities and properties—pieces of context such as page and event location—that are linked together to form a journey for each customer interaction.
Why use behavioral data?
There is simply no better predictor of future behavior than past behavior—our actions today are highly indicative of what we’ll do tomorrow.
"Organizations that leverage customer behavioral insights outperform peers by 85% in sales growth and more than 25% in gross margin."
McKinsey & Company
Enterprises like Airbnb and Spotify have been creating their own data to power behavioral data products like churn propensity models, recommendation engines, and predictive lead scoring for years. These products give them a huge competitive advantage.
Smaller companies have typically relied on easier-to-use datasets, such as transactional and demographic data—because behavioral data feels too hard. Challenges include reconciling data from disparate sources; complying with GDPR, CCPA and other rules; ITP and ad blockers; and more, which we explore below.
This is beginning to change. Companies of all sizes are adopting behavioral data to power data products, which is ringing in a new era of hyper personalization and a marketplace in which companies compete on how deeply they understand user touchpoints.
The same is now true of understanding AI agent behavior.
Behavioral data in the AI agent era
Behavioral data has always described how humans interact with your digital estate. That definition is now expanding rapidly.
AI agents — autonomous software programs that browse websites, fill forms, and complete purchases on behalf of users — now generate a significant and growing share of web traffic. McKinsey estimates that between 20% and 50% of web traffic is already AI-generated. According to HUMAN Security, agentic browsing traffic grew 6,900% year-over-year from 2024 to 2025, driven by the mainstream arrival of tools like Perplexity Comet, ChatGPT Atlas, and Gemini in Chrome.
This creates two distinct challenges for anyone relying on behavioral data.
First, AI agents contaminate your human behavioral data. Because most analytics tools cannot reliably distinguish an AI agent from a human visitor, agent sessions inflate pageview counts, suppress conversion rates, distort bounce rate, and corrupt the ML models trained on that data. Your metrics are telling a mixed story, and most teams don't yet know it.
Second, agent behavior is itself valuable signal. Understanding which agents visit your site, what content they fetch, and how they navigate tells you how your brand is being represented in AI-generated answers and recommendations, a fast-growing source of referral traffic and commercial intent.
Not all agents should be treated the same. There are broadly three types visiting your site:
- Agents to block — competitive scrapers harvesting your pricing or content for a rival's benefit
- Agents to serve well — AI platforms like ChatGPT and Perplexity whose crawlers determine how your content appears in AI-generated answers
- Agents to build — your own customer-facing AI agents, which need rich behavioral data to deliver personalised, context-aware experiences
Without behavioral data that captures all three, you cannot make these distinctions, or act on them.
Snowplow captures both layers — human behavioral data and AI agent analytics — in a single unified pipeline, so your core KPIs reflect human reality and your agent data is available separately for analysis and activation.
Learn more: What is an Agentic Browser? · Agentic Browsing Is Here. Is Your Analytics Stack Ready? · How to Detect Bots and AI Agent Traffic on Your Website
How is behavioral data different to other data types?

What does behavioral data look like?
Before looking at the actual data, let’s take a look at its structure. The components of behavioral data can be broadly divided into three groups that mirror a real language.
- Main entity (subject) – The main actor or entity, normally the user, customer, or AI agent acting on their behalf.
- Event (verb) – Describes the event (e.g. ‘button click’).
- Other entities & properties (objects) – Context to better understand the event (e.g. location of event).

Here’s an example of behavioral data created by Snowplow. It was part of a content recommendation engine, with a score generated based on time engaged on page, scroll depth, and an in-session index.
This data has already been modeled and is grouped by ‘pageview’. It is based on one atomic data set containing all the columns and rows. Behavioral data can be sliced and diced in different ways, including bringing it to a pageview, session and user level, or analyzing by product, author or even weather situation.
Added to this, we could include additional business logic, such as an ‘aging factor’, which takes into account that a pageview two years ago is normally worth less than a pageview today.

Below, you’ll find data based on the same atomic data set as the table above. This time it’s aggregated by ‘page title’ rather than ‘pageview’. Viewing the data by page title (blog post) allows us to see the average pageview score for each post and decide which content is performing best.
You can use these data sets for advanced analytics – or BI – where a human analyst sets the scoring and uses SQL to find patterns. Or you could use them for AI and ML, whereby the data is used to train an algorithm to allocate the optimal scores in each category and even make decisions based on these scores, such as featuring different content on your homepage in real time based on a user profile. Or you can use them to understand how AI agents are navigating your content in terms of which pages they index most frequently, which they ignore, and how that maps to AI-generated referral traffic.
The scores a, b…f can be derived from different combinations and weightings of the first three metrics, depending on the context, which helps analysts understand the data through different lenses.

Data products made better with behavioral data
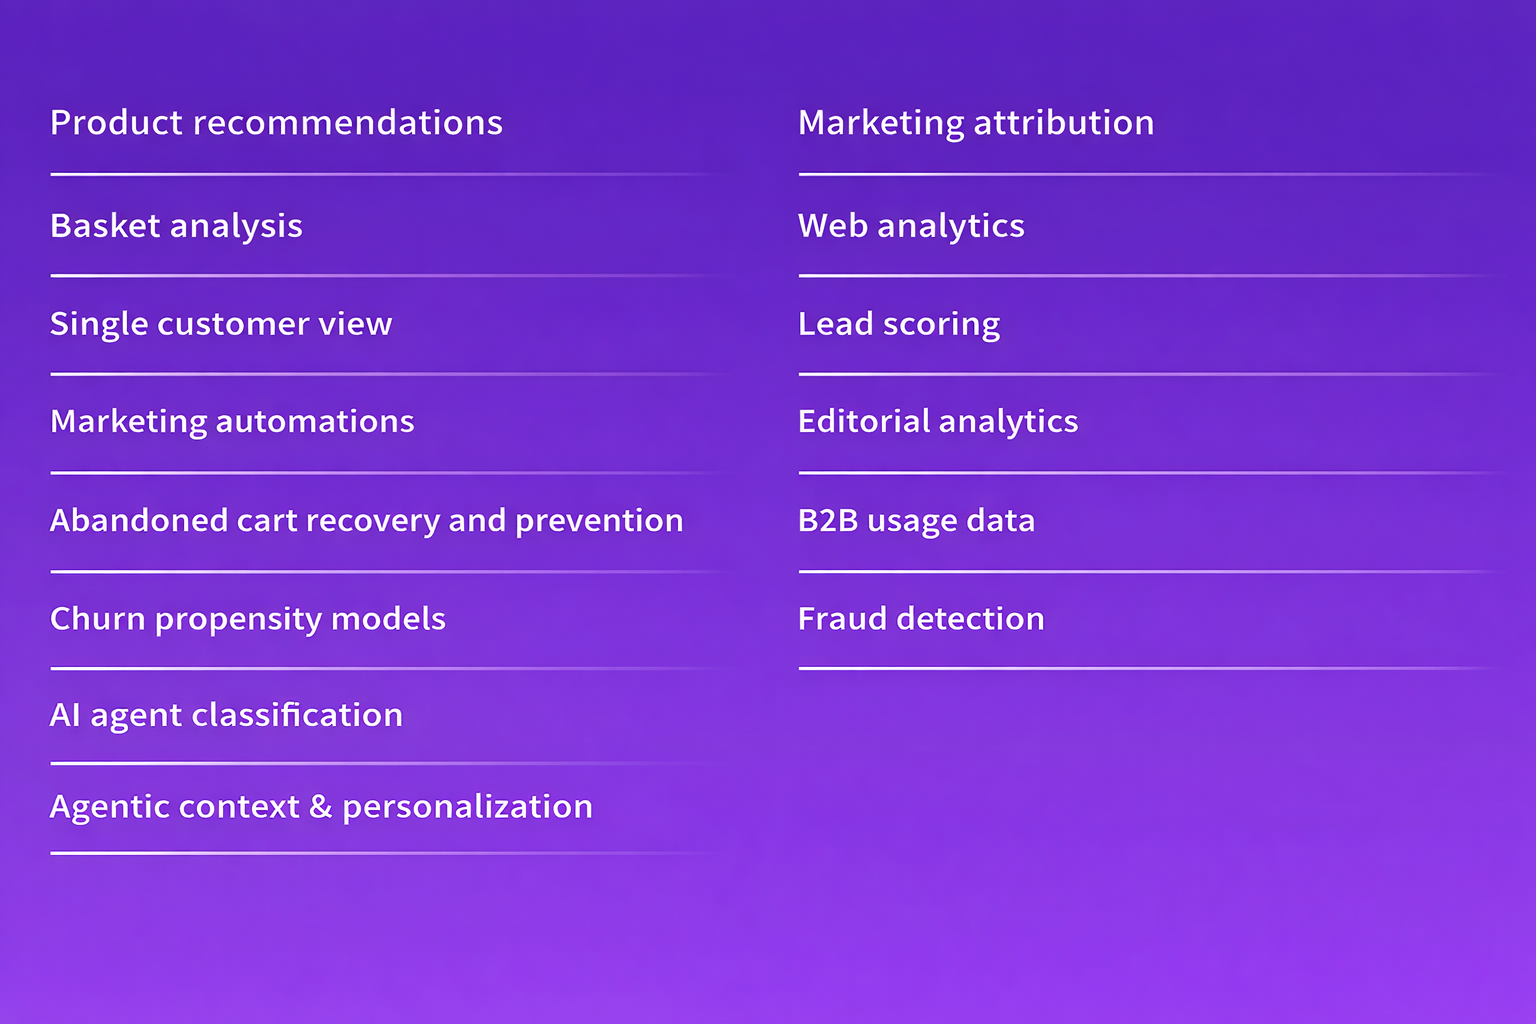
Do you need behavioral data for all these data products?
While you can create many of these data products with other types of data, you won’t generate such predictive or insightful results.
For example, a Fraud Detection Engine could be created by analyzing patterns in transactional and demographic data, and looking for anomalies.

Behavioral data adds an extra dimension to our analysis. In the above example, we could look at the behavioral predictors of fraud, such as:
- Auto filling forms with different details
- Minimal scroll depth
- Low number of pages viewed
This would give us a better understanding of the indicators of fraudulent activity.
The same logic applies to AI agent detection. Transactional or demographic data cannot tell you whether a session was initiated by a human or an agent. Only behavioral data, specifically event-level signals like mouse movement patterns, scroll velocity, click timing, and session pacing, provides the granularity needed to classify sessions accurately.
Learn more about how this works in How to Detect Bots and AI Agent Traffic on Your Website.

As you can see above, behavioral data is particularly powerful as it can be enhanced with other data types. Further, as a data application develops, you gain new, deeper insights into a given behavior—which in turn unlocks more value and spins off into new data products.
Two types of behavioral data
Historically, for organizations to leverage behavioral customer data for data applications and analytics, they were limited to using byproduct data of existing SaaS products—which we call data exhaust. It’s now possible for companies to purposefully create their own powerful behavioral data, with a Data Creation approach pioneered by Snowplow.
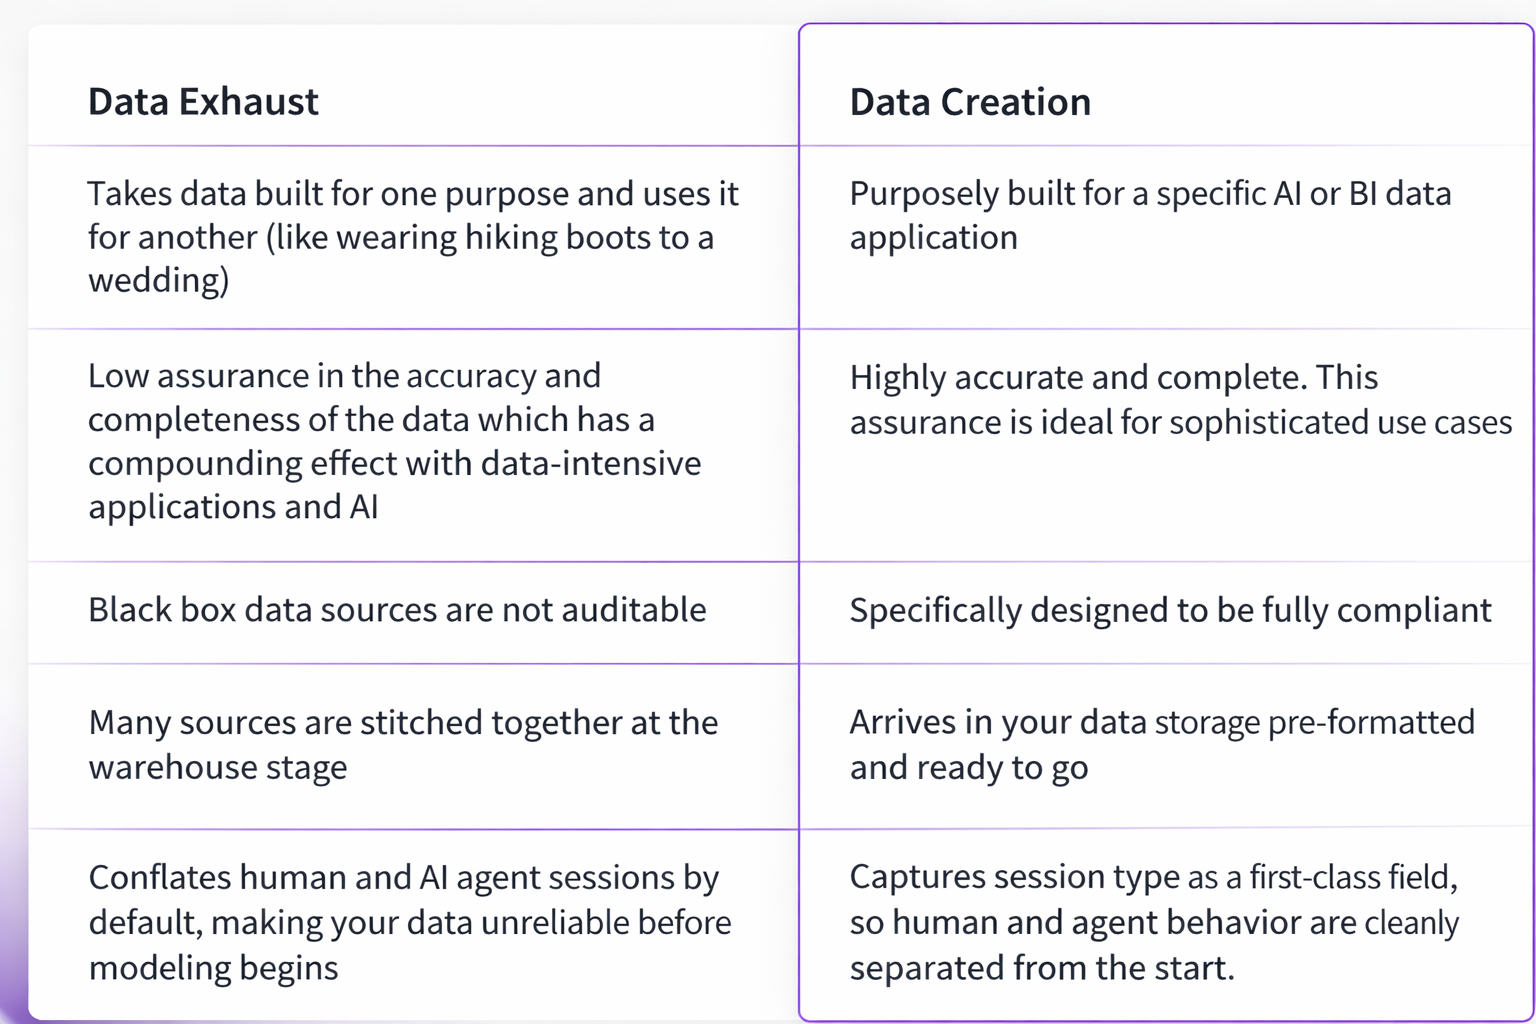
Behavioral data exhaust
Behavioral data exhaust is data that is extracted from different SaaS products. For this reason, it has different levels of aggregation, proprietary SaaS logic, and varying levels of quality and completeness.
The upshot is that when this data is extracted from its original source, it’s used in a way it was not designed for.
An example would be taking pageview data from Google Analytics, which is primarily designed to be viewed in the Google UI, exporting it to a data warehouse, and combining it with Salesforce data to attempt to get a full picture of reader behavior. The two data sets have their own embedded logic and structures, which have to be unpicked before being combined.
This embedded logic in black box SaaS products can range from the predefined length of a session to how user sessions are stitched together. Nested table structures and stateful joins also make it very challenging to aggregate data to the same altitude, causing queries to become needlessly complex.
It’s all enormously time consuming—like unraveling an ever-growing ball of yarn. Ultimately, data teams become wranglers and cleaners, rather than creators. In the AI agent era, this problem compounds: exhaust data from tools like GA4 cannot reliably separate human sessions from agent sessions, meaning the data you're wrangling is already compromised before you begin.
Behavioral Data Creation: a new methodology
You wouldn’t use generic copy to describe your product to your customers, so why would you use generic data to describe your user journeys? The problem with a one-size-fits-all approach is that it might not actually fit anyone perfectly.
Data Creation is a new way forward. It’s about purposely creating behavioral data for each data product you produce. Each metric can be tailored to your company’s internal logic and vocabulary.
The resulting data does not have SaaS logic which needs to be removed, such as predefined session lengths or naming conventions. The data can be customized to include any extra contextual information (entities/properties) relevant to your event.
A good example of how to use this bespoke data comes from Strava, a digital wearables company. They create metrics which describe highly customized user journeys, such as minutes active in a day, miles run in a session, and so on. This is very challenging and ineffective when exhaust data is used, but becomes easy with Data Creation.
Data Creation is also the foundation for reliable AI agent analytics. Because created data is built to your business logic from the ground up, you can include agent-specific entities and properties — such as autonomous system classification, bot score, and session type — as first-class fields in your schema. This makes it possible to build a truly unified pipeline where human and agent behavior are captured in the same warehouse, with clear lineage and no ambiguity about what each event represents.
Learn more: Agentic Browsing Is Here. Is Your Analytics Stack Ready?
LEARN MORE ABOUT DATA CREATION
Why is behavioral data so challenging?
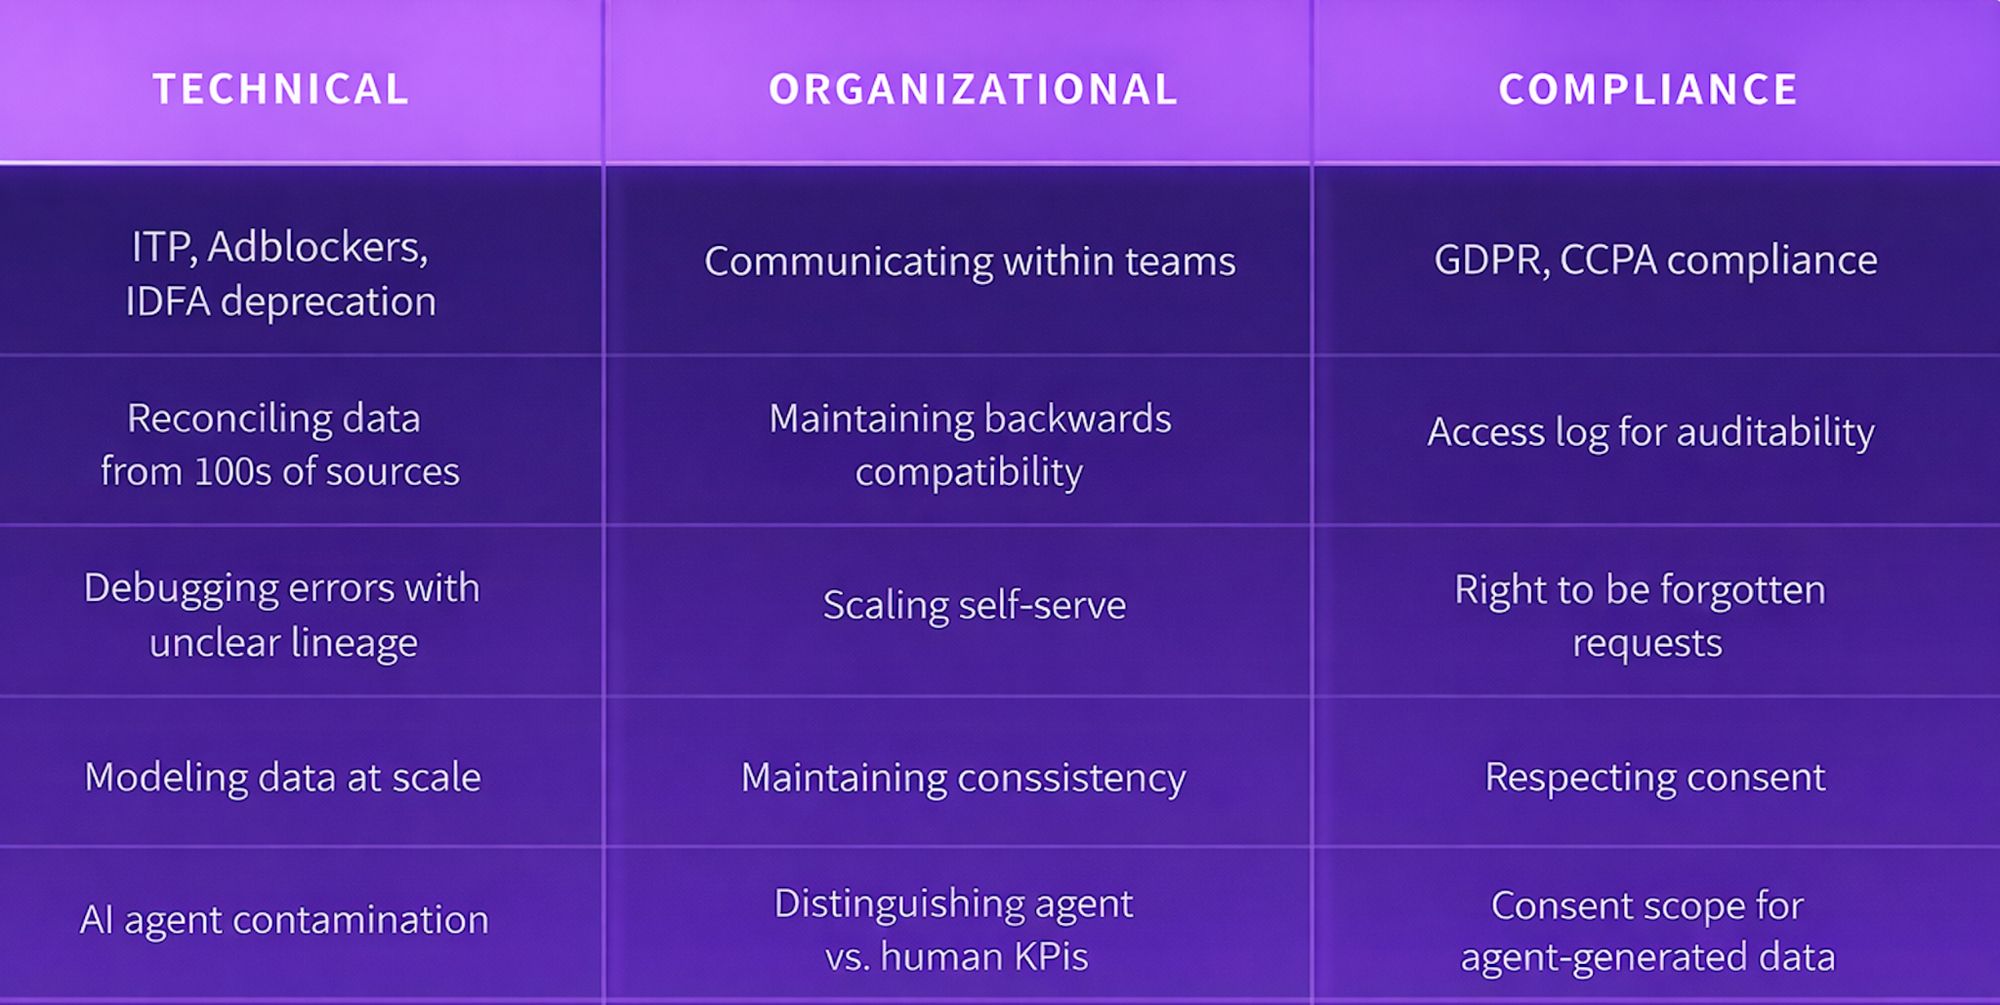
We’ve already discussed some of the difficulties with managing behavioral data. As the table above shows, some companies face further challenges. Let’s explore these issues in detail, before explaining how Snowplow addresses them.
Technical challenges
- Tracking prevention – As tracking is increasingly restricted through Intelligent Tracking Prevention (ITP)—spearheaded by major tech companies such as Apple and Mozilla—building an accurate 360° customer view is far more difficult. Safari users, for example, often make up a sizable proportion of traffic to a website and Apple users can be overrepresented in wealthier demographics. ITP limits tracking to only 2 days for these users, heavily skewing the resulting data. Analysts will see far more users/sessions/pageviews than actually occurred.
- Reconciling data – Taking data from many sources and reconciling it into one coherent data set is a gargantuan job. Indeed, many data teams wrangle data for so long that they are unable to operationalize it. This also leads to an issue of unclear lineage, whereby it is not evident where, how and why the data was created.
- Debugging errors – Data which is incomplete or inaccurate can create misleading results. When behavioral data is prepared without significant forethought or documentation, it can require a great deal of debugging. Any discrepancy between the tracking design and the tracking implementation can cause systemic errors, and combining different data sets leaves a lot of room for human error.
- Modeling data at scale – Poor naming conventions, the wrong levels of granularity, overuse of calculated fields—all these things and more need to be considered when scaling your data modeling. Small problems can proliferate quickly as data sets grow.
- AI agent contamination — Analytics platforms that cannot distinguish AI agents from human visitors corrupt the behavioral data underpinning your most important decisions. Bounce rates, conversion rates, engaged time, and A/B test results are all affected. As agentic browsing traffic continues to grow, this challenge will intensify for any team relying on standard web analytics tools.
Organizational challenges
- Communicating within teams – When the ‘where, how and why’ of data is not recorded systematically, data is not explainable within teams. Knowing exactly what a tracking designer intended and how the front-end dev interpreted this information can require Sherlock-Holmes-level skills and some seriously long Slack threads.
- Maintaining backwards compatibility – Understanding where breaking and non-breaking changes have been made to tracking is essential to maintain backwards compatibility. This represents a significant challenge for many teams. Learn more about breaking and non-breaking changes.
- Scaling self-serve – As teams grow, compounding complexity is inevitable (see the image below). In order to scale self-serve capabilities in your data stack, it’s critical to understand the needs of each new team member and how these intersect with the existing team. Due to the complexity of behavioral data, this can be particularly challenging.
- Maintaining consistency – Versioning data schemas and keeping track of these changes is a significant challenge. When data dictionaries are kept as ad hoc spreadsheets, the issue is exacerbated.
Compliance challenges
As you have probably gathered, all these challenges are interlinked. If you don’t understand data lineage, data is not explainable to your teams. It also means data is not easily auditable for compliance inspections.
- Auditability – Retroactively making data auditable can be a nightmare for data teams, and whole quarters can be lost if planning is not done up front.
- GDPR/compliance – This includes the right to be forgotten, consent, storage location, information security and access, and many other data laws and regulations. When data teams don’t trust that GDPR/compliance is in place, they often take the ‘safe’ route of discarding the data. This wastes highly valuable information.
As AI agents grow in prominence, compliance teams also need to consider how agent-generated data is captured and attributed. This is particularly crucial where an agent is acting on behalf of a user whose consent scope may not explicitly cover automated interactions.
How Snowplow solves for the challenges with behavioral data
- Tracking – First party tracking means ITP does not apply—you can track users for up to 2 years, even on Safari and Firefox.
- Single source of truth – Data does not need to be reconciled across sources—it’s created from scratch to match your business logic and vocabulary, and then prevalidated so it arrives in an atomic data table ready for AI and BI use cases. Human sessions and AI agent sessions are both captured and automatically segmented, so your KPIs always reflect human behavior.
- Lineage – Created data has 100% transparent lineage. With Snowplow, the meaning of each metric is recorded in a human and machine readable format in JSON schemas.
- Alignment – A centralized UI helps teams navigate the complexity of managing behavioral data, controlling permissions, showing tracking in a visual way, and managing schemas.
- Consistency – By using Snowplow’s Universal Data Language, you can ensure meaning is tightly documented and versioned across teams.
- Compliance – You have full ownership of your data. The whole Snowplow infrastructure lives on your own cloud—meaning a choice of storage location, full GDPR compliance, the option to have multiple pipelines, and the ability to record the basis for capture with each event.
- AI agent detection and analytics — Snowplow enriches events with autonomous system classification, bot scoring, and user agent analysis at ingestion. Combined with CDN and server log ingestion (Cloudflare, Vercel, AWS CloudFront), Snowplow surfaces the full picture of who — and what — is visiting your site. Snowplow Signals enables real-time behavioral profiling to detect mid-session agent handoffs and power adaptive responses.
Learn more: How to Detect Bots and AI Agent Traffic on Your Website