
Agentic Analytics vs. Traditional BI Tools: What’s Actually Different This Time
Self-serve BI was supposed to be the great data democratizer. The hope was that if you give everyone in the business access to dashboards and data, they’ll make better decisions. They’d be able to answer their own questions, without having to wait three weeks for an analyst to pull a report.
That was the pitch, anyway.
In practice, traditional business intelligence (BI) tools did serve some use cases well. Dashboards are good at showing you what happened. Pivot tables let data-savvy users explore why. But they couldn’t cover all the use cases needed to truly democratize data.
As a result, most business users still ended up filing tickets with the data team, because the tools only answered a predefined set of questions. Anything beyond that required someone who understood the data deeply enough to explore it themselves.
Now agentic analytics is promising to plug that gap. Instead of navigating dashboards or mapping questions to tables, you ask a question in plain language and an AI-driven agent writes the query, runs the analysis, and gives you an answer. Agents can handle open-ended questions, not just predefined ones. That’s a meaningful expansion on what was ever possible with BI tools.
So is it different this time? Maybe. But there’s a wall most companies are about to hit: without the right context baked into the data, agents deliver confidently wrong answers. And once someone gets a wrong answer they trusted, they stop coming back. Different failure point, same outcome.
Here, we break down what traditional BI tools actually do well, where agentic analytics improves on them, and why the data foundation underneath is what determines whether any of it works.
What traditional BI tools are actually good at
Before getting into what’s changed, it’s worth being honest about what traditional BI tools do well. This isn’t a hit piece on dashboards.
Business users typically want to know three things:
- What happened? Revenue dropped. Conversion rates shifted. A campaign underperformed.
- Why did it happen? Was it a specific geography? A change to the user experience? A new marketing campaign targeting the wrong users? A seasonal pattern?
- What should we do about it? Which levers are available, and which ones should we pull?
As a reporting tool, BI has historically served the first question well, made a start on the second, and barely touched the third.
Dashboards answer “what happened.” They give data teams a way to build views that other teams can consume. Key metrics, trends, things that look off. If something’s wrong, a dashboard can point you in the right direction. But this is limited by design. A good dashboard is selective. It answers a predefined set of questions about the business. You don’t need deep data knowledge to use one effectively, but you can only see what it was built to show you.
Pivot tables start to get at “why.” They give data-savvy business users a more flexible interface: select different combinations of dimensions and metrics, filter and aggregate, spot trends and drill into them. If you see conversion rates dropped, you can slice by marketing campaign and discover a new campaign is dragging the average down. Maybe it’s targeting the wrong type of users. But pivot tables require the user to map their question to the data themselves. You need to understand the underlying tables well enough to explore them, and most decision makers don’t.
That leaves questions two and three largely in the hands of data analysts and scientists. Even with static dashboards available, the data accessibility gap means business users end up filing tickets and waiting, manual reporting by proxy. The self-serve promise never materializes.
That’s the gap agentic analytics claims to close.
What agentic analytics actually changes
Agentic analytics enables business users to ask and answer open-ended questions about their data. That’s fundamentally different from dashboards, which answer a predefined set of questions about what happened, and pivot tables, which require the user to map their question to the data tables themselves.
Because data agents can perform analytics and data science, they can answer questions about why something happened, and — with the right context — suggest which levers to pull. Agents can analyze data across multiple data sources in ways that pivot tables can’t: joining tables, testing hypotheses, running multi-step analyses, even basic predictive modeling. Compared to traditional BI, that’s a significant expansion of what’s possible, with no human intervention required to translate a business question into a query.
But the thing that actually gets you to actionable insights is less about the agent and more about what you feed it.
Think about what a good business analyst would need to answer these questions. They’d need contextual knowledge about the business — how it works, how it makes money, where it incurs cost. They’d need to understand why the business is asking the question it’s asking, and what a good answer would look like. They’d also need a solid understanding of the data itself — what it means, how it’s structured, how to correctly query and aggregate it, and any quality issues or limitations to account for.
An agent needs all the same context.
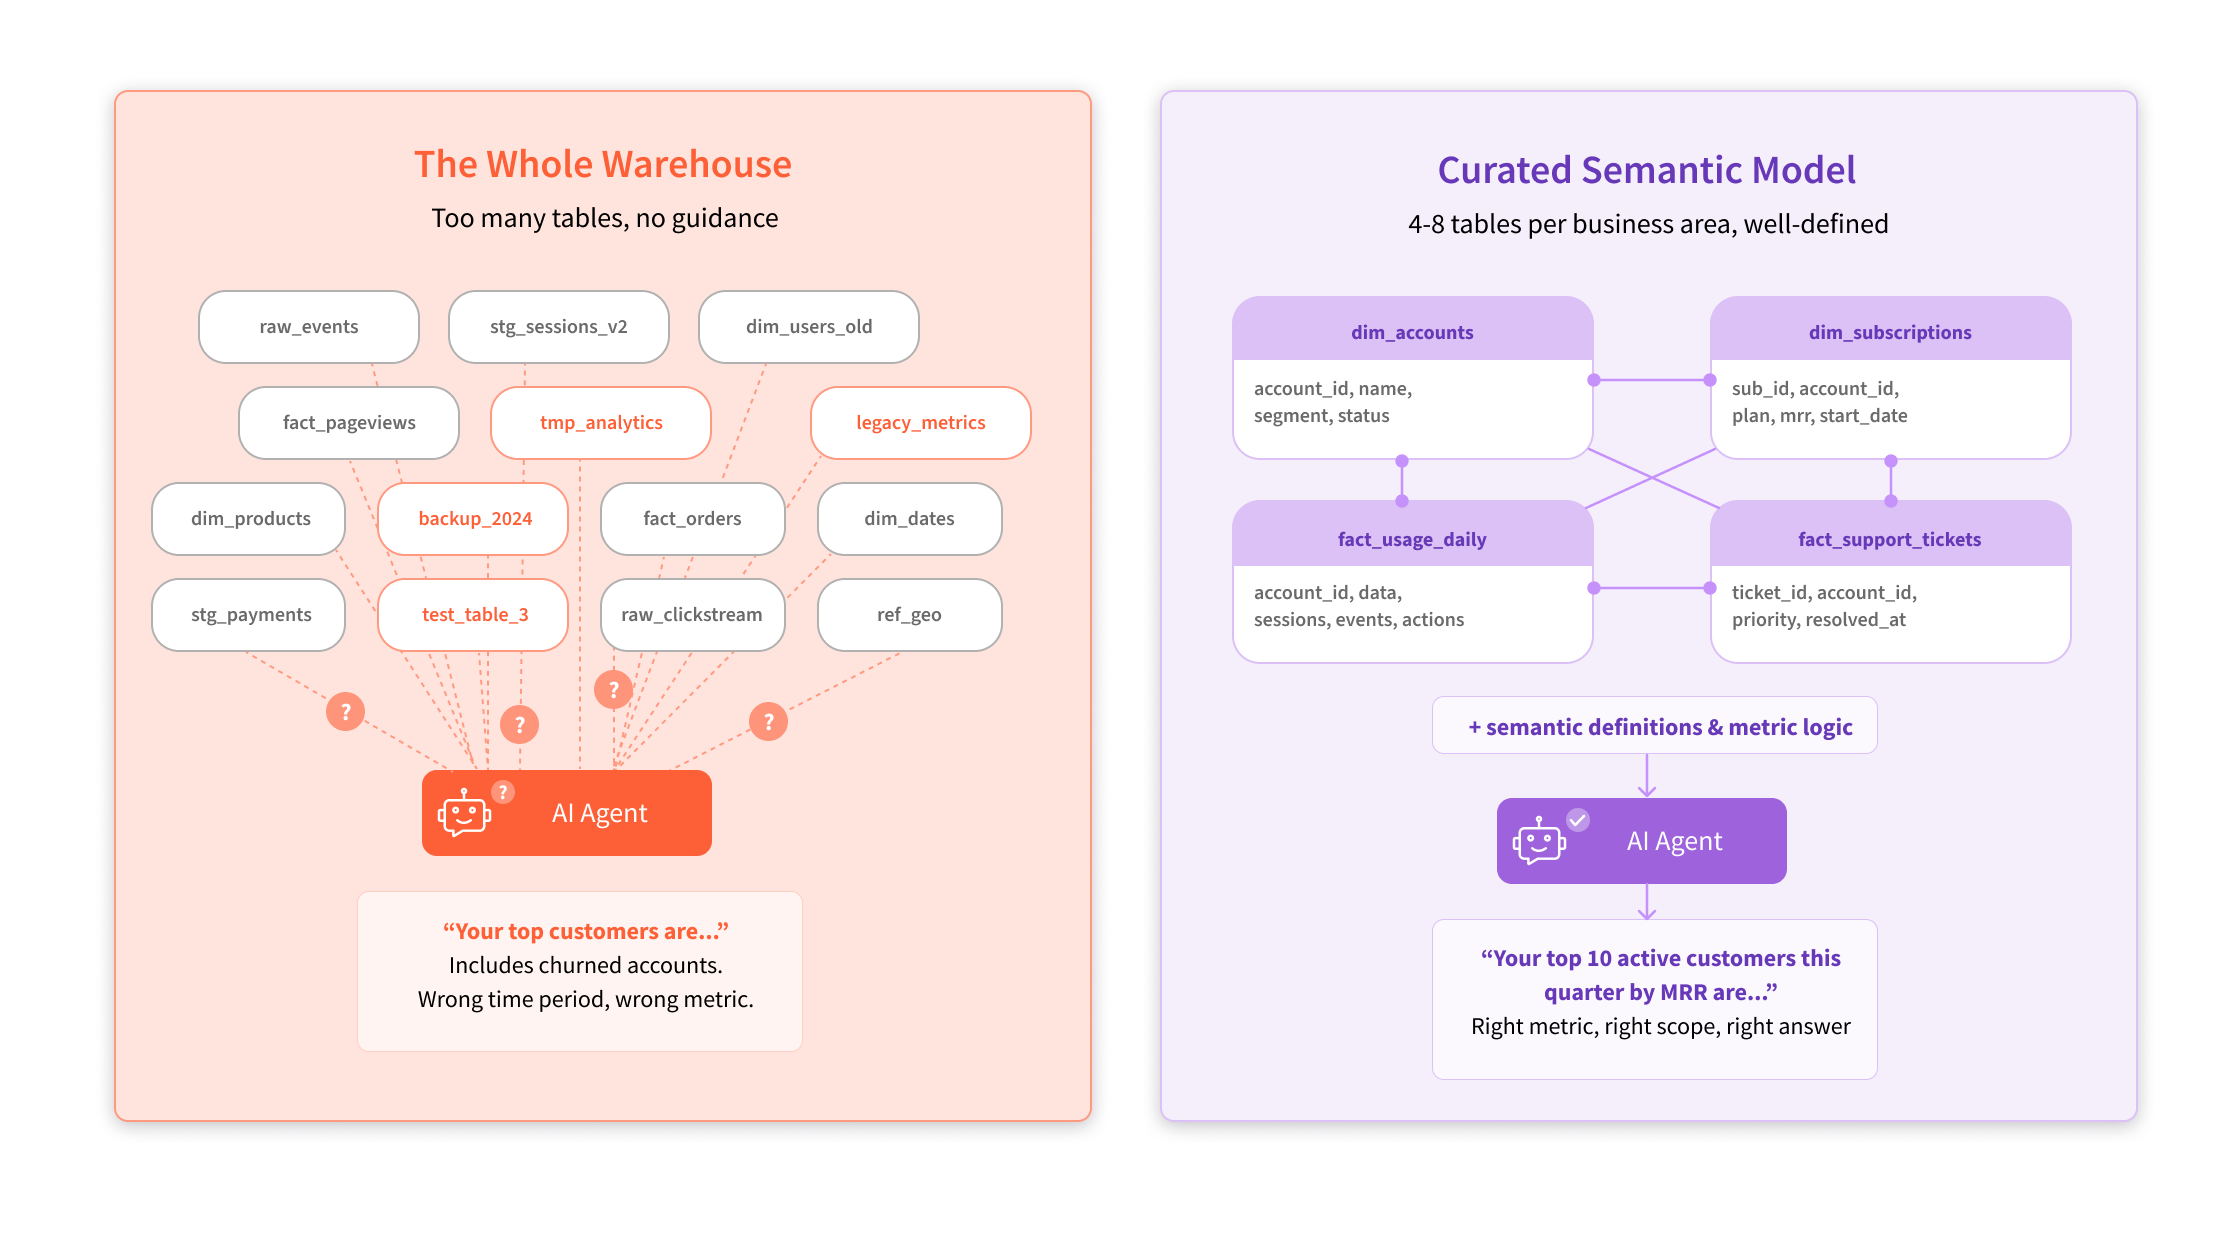
Within that, you can distinguish two types of context: knowledge about the business and domain, and knowledge about the data itself. The latter is often captured as a semantic model — a curated layer that defines which tables matter, how they relate, and what the metrics mean. In practice, this typically means 4 to 8 well-modeled tables per business area. Less is more. Point an agent at your entire data warehouse — hundreds of tables across multiple data warehouses — and it’ll drown. But give it a tight, well-modeled set of tables that analysts already use and trust, and it performs.
In practice, this approach looks something like this:
- Choose the business area you want to cover
- Identify the top 4-8 tables your analysts use to answer 90% of questions reliably
- Combine the tables into a semantic model (essentially a clean entity-relationship diagram)
- Point the agent at the semantic model
A support team, for example, might use dim_accounts, dim_subscriptions, fact_usage_daily, and fact_support_tickets. Four tables with clear relationships that cover the vast majority of questions about that business area.
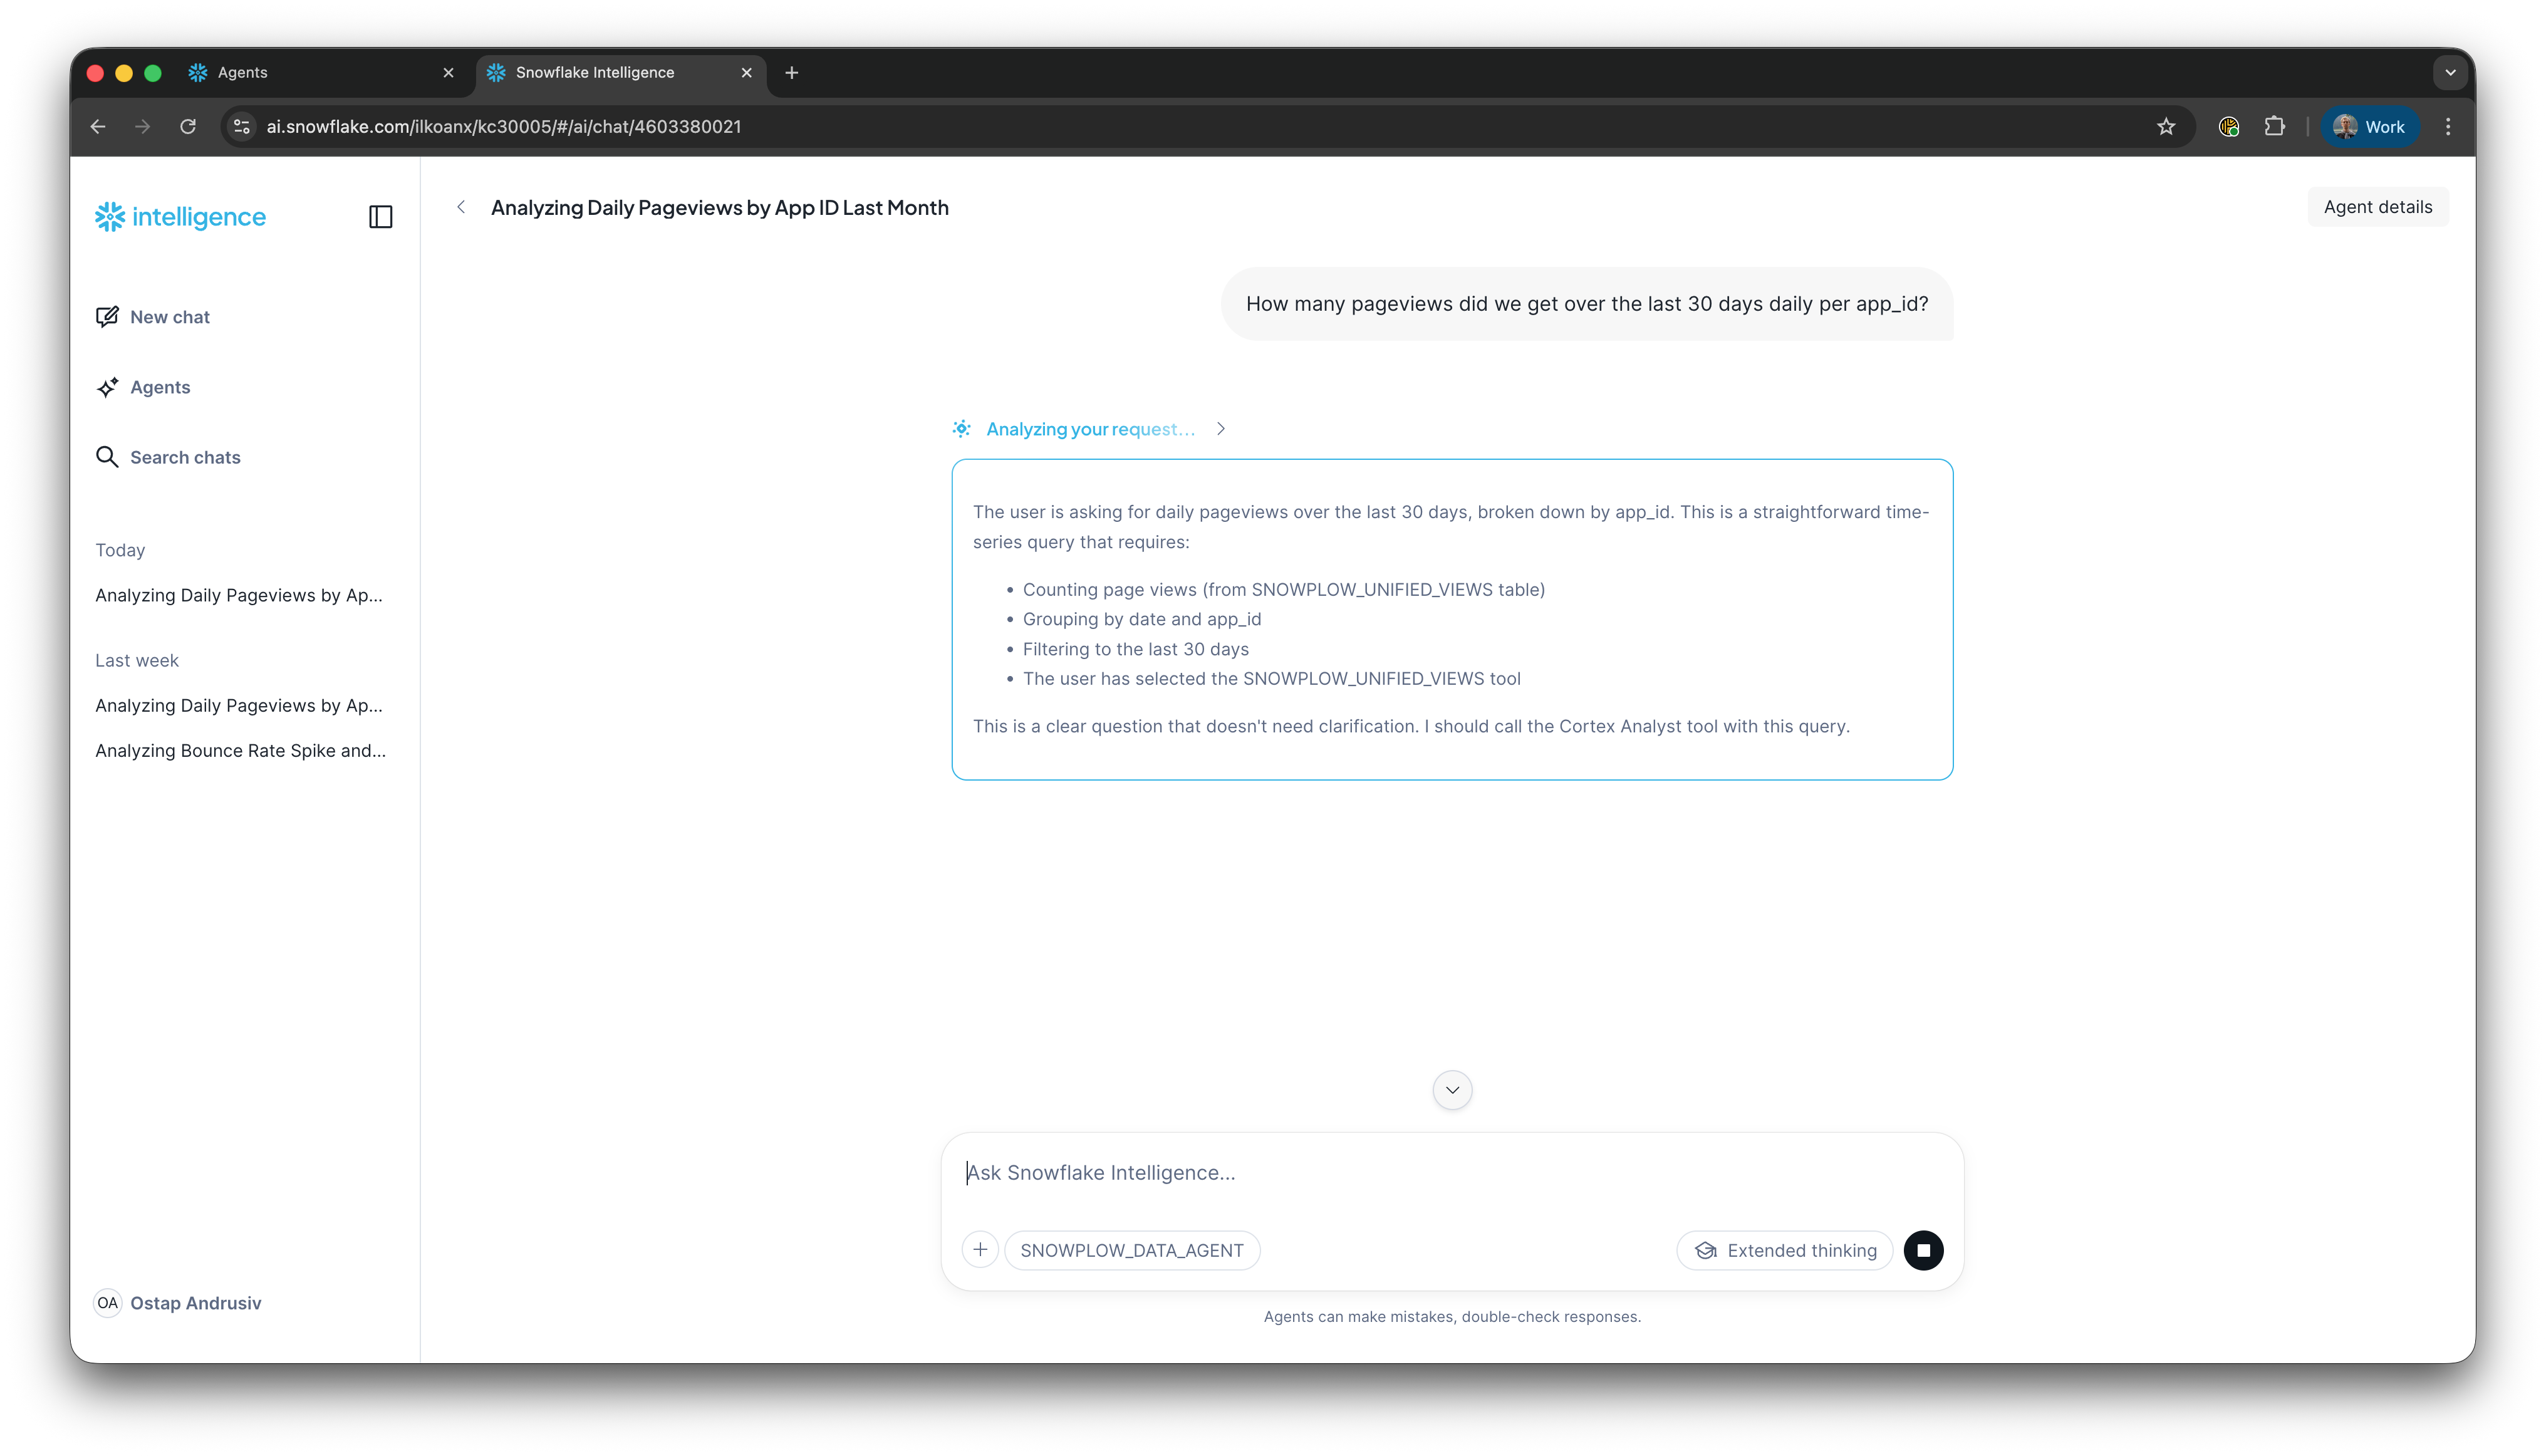
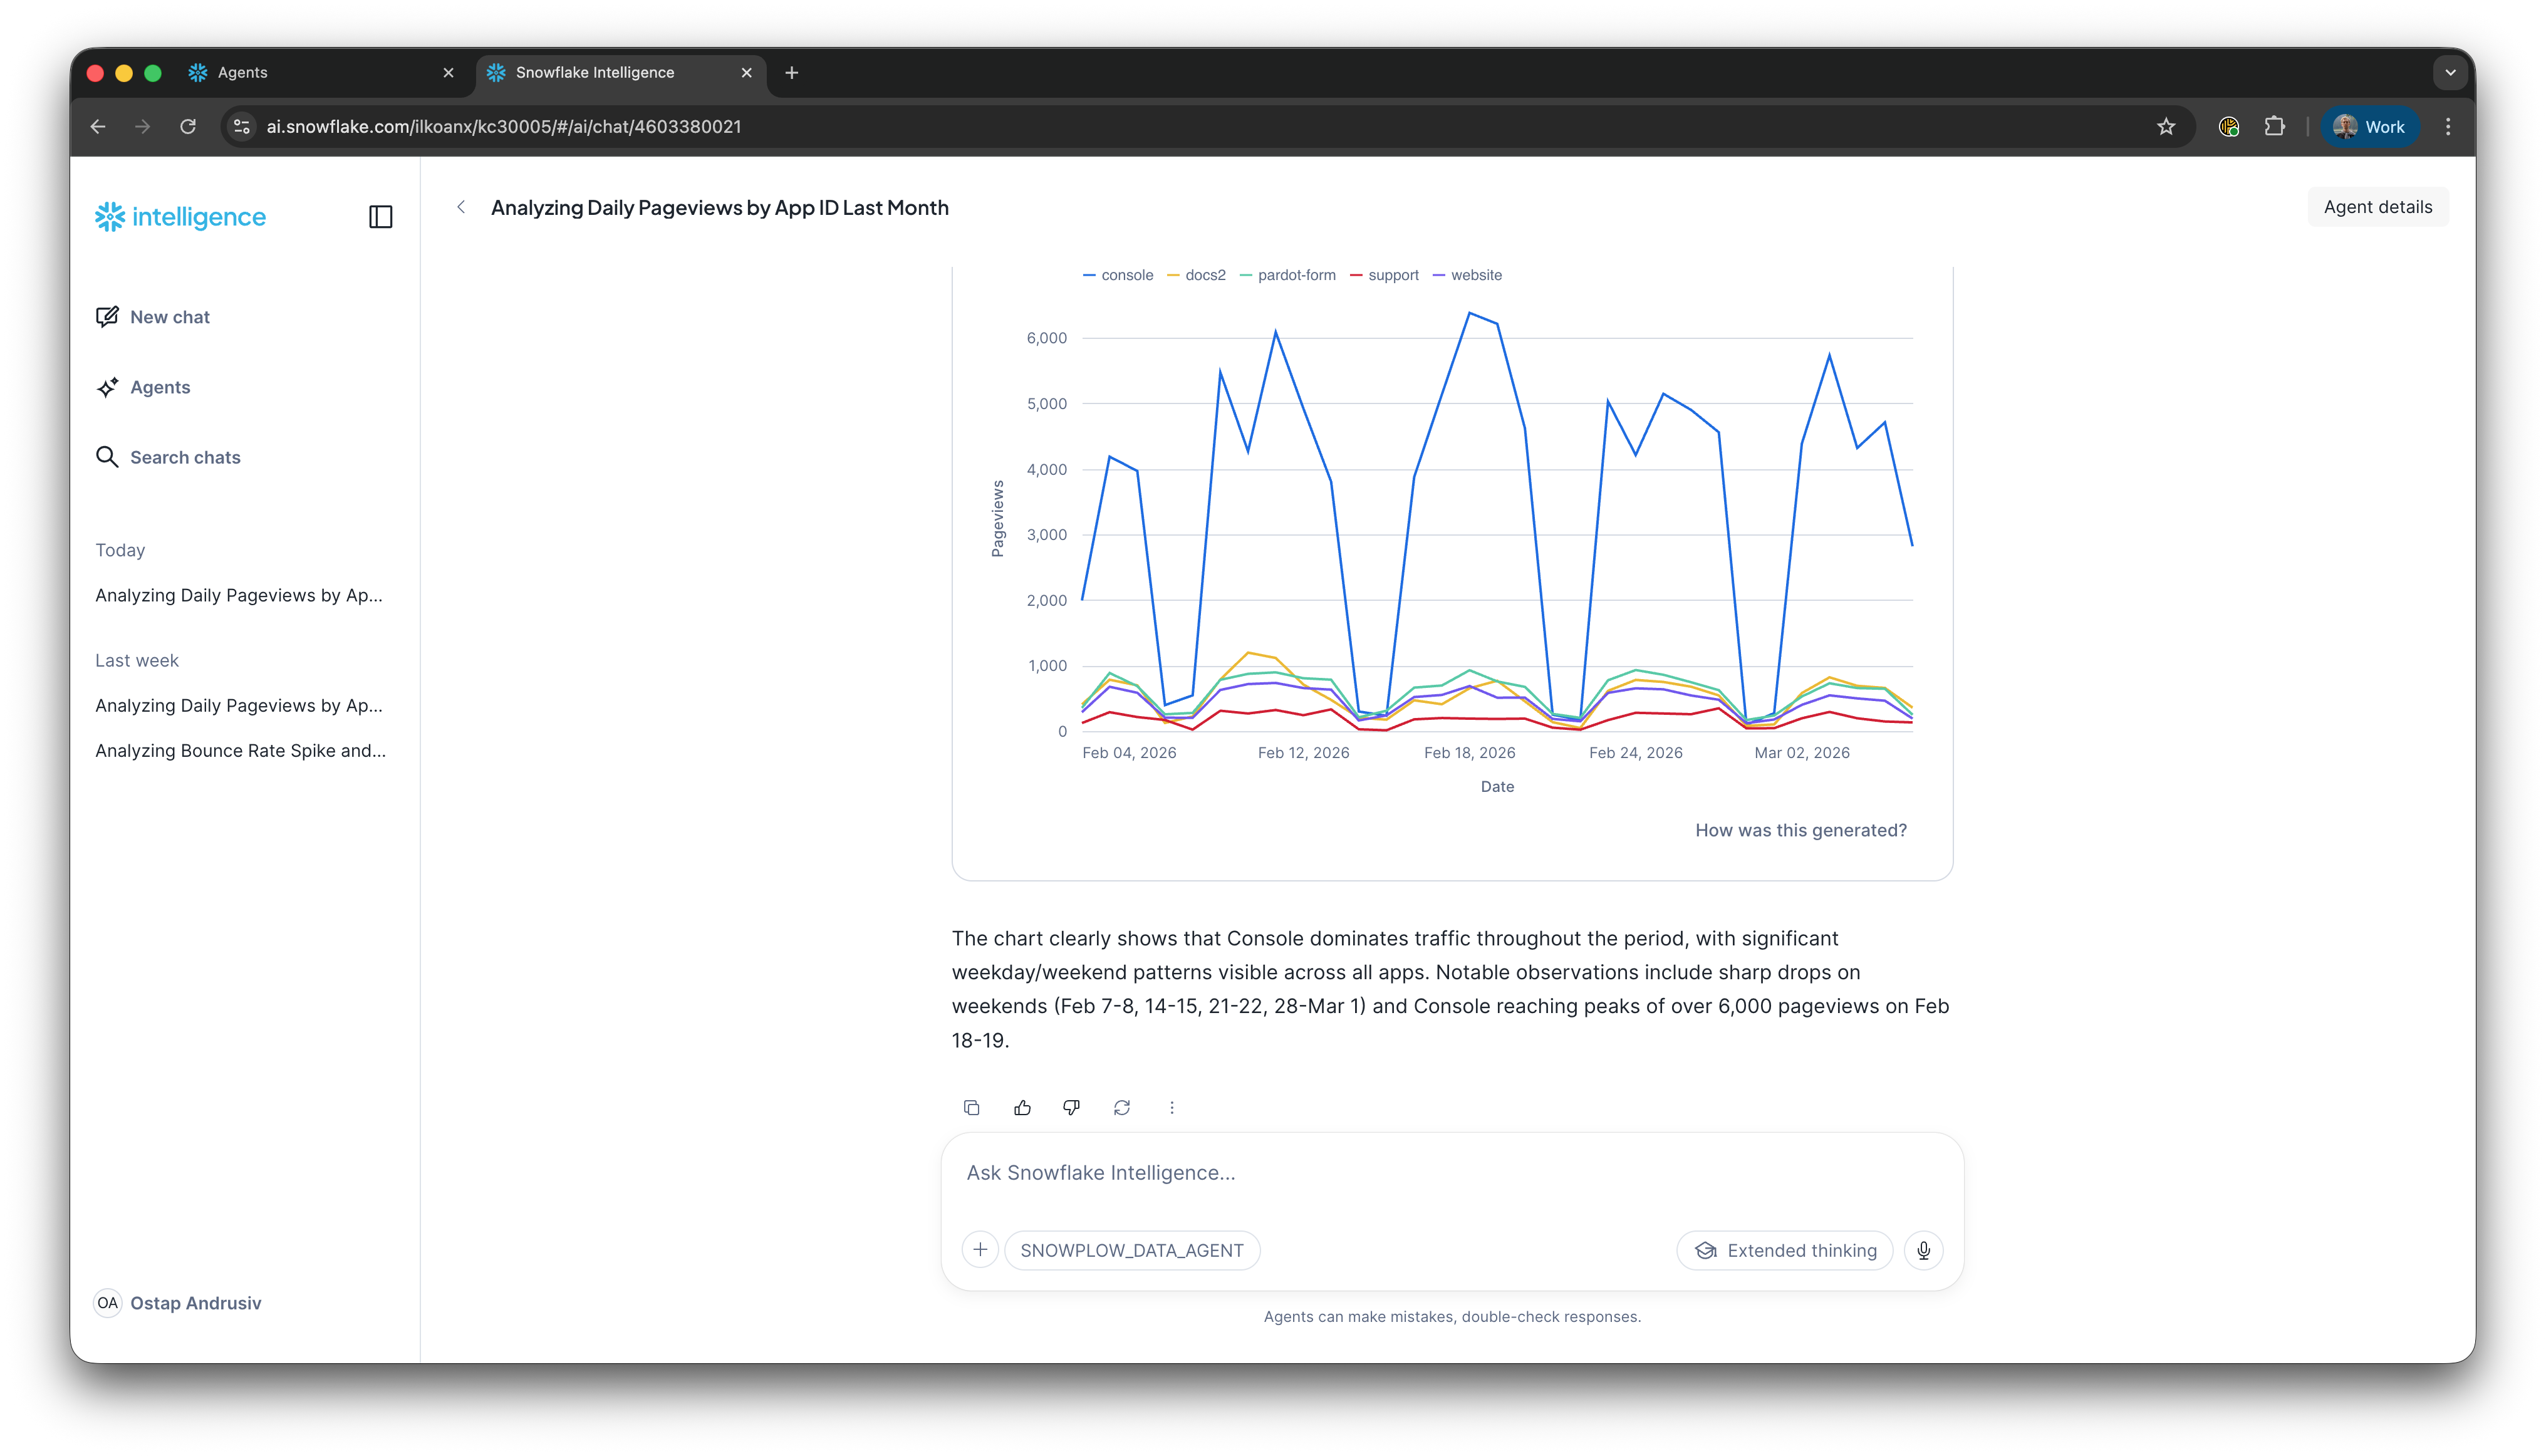
Insert the Snowflake Playground screenshot showing the agent reasoning through "How many pageviews did we get per host in the last 30 days?" Demonstrates what it looks like when you point an agent at a well-modeled semantic view.
But what if that curation hasn't happened? If your agent has access to too many tables, with no guidance on which ones matter, which are high quality vs. legacy vs. unsupported, anything downstream will break down.
The context gap: why most agentic deployments will fail
Like the vast majority of agents, data agents need carefully managed context to be successful. And that context comes in two layers. Getting either one wrong inevitably produces confidently wrong answers.
The first layer is business context. Your agent needs to understand how the business works, what its KPIs are, how “conversion” is defined in your company, what campaigns are running, and what levers are available. This isn’t metadata about the data. It’s knowledge about the world the data lives in. Without it, your agent can write a technically correct query that answers the wrong question entirely.
The second layer is the metadata foundation. This is the data that describes your data — part of the broader data foundation, but specifically the layer the agent needs to understand what it’s looking at. It explains what tables exist, how they relate to each other, how the data was generated, and what each column actually means. Without it, your agent will end up guessing at schema, joining the wrong tables, and misinterpreting fields.
According to Gartner, 60% of AI projects will fail this year due to lack of an AI-ready data foundation. And 63% of organizations either don’t have or aren’t sure they have the right data management practices for AI. That’s a problem.
We typically see two common mistakes when companies connect their agent to their analytics data for the first time:
- Firstly, they give it access to too many tables and columns. As we mentioned before, curated small datasets per business area consistently give better results than pointing an agent at the full warehouse
- And secondly, they didn’t describe the business case well enough. What are these tables about? What kinds of questions do people usually ask? What do good answers look like? If you don’t tell the agent, it has to guess. And it will guess wrong.
Consequently, we often hear people complaining that their agents “forget context” or “pick the wrong statistical test.” This is almost always a context engineering problem. If you precisely tell your agent which columns are useful for which answers, and describe the expected result well enough for the agent to self-verify, it should get a good-enough answer. But that precision has to exist in the metadata layer. You can’t improvise it at query time.
Here’s a common scenario we see play out. Someone asks an agent: “Who are our top 10 customers?” The agent comes back with a confident, nicely formatted list. Top 10 by lifetime value, all time, including customers who churned two years ago. This is technically correct, but completely useless.
A good analyst would have asked clarifying questions first. Which time period? Which geography? Active customers only, or including churned? But the agent doesn’t ask. It just picks the most literal interpretation and runs with it.
Thankfully, this is fixable, but only if you’ve done the work upfront.
Consider providing example question-and-answer pairs so the agent knows what “top customers” actually means in your business. Describe how your specific metrics should be calculated when someone asks about them. You can even guide your agent to do some back-and-forth before answering, the way a good analyst would.
Over time, these examples can be extracted into an internal data analytics skill — a curated set of your company’s analytics best practices that improves as people use it. Without this context within your metadata layer, your agent will simply keep delivering confident answers to the wrong questions.
According to IDC, by 2027, companies that don’t prioritize high-quality, AI-ready data will struggle to scale their agentic solutions, resulting in a 15% productivity loss.
What an AI-ready data foundation actually looks like
The metadata foundation is one piece of the broader AI-ready data foundation your agent depends on. While there isn’t a single checklist that guarantees an AI-ready data foundation, there are several key ingredients that make a real difference. Each one of these reduces the surface area for agent error.
Well-modeled tables. The messier the data, the more transformation your agent has to do before it can answer a question. Every transformation adds cost and creates opportunity for error. The less your agent has to do to make the data usable, the more reliable the output.
Clearly defined metrics. Let’s say “churn” isn’t precisely defined in your data. Your agent will measure it wrong. It’ll give you a confident answer to “why did churn go up?” based on the wrong calculation. If this multiplies across every metric of your business, you’ll see how quickly trust erodes.
High-quality data. If your data has gaps or inaccuracies, even the best agent in the world won’t reason correctly from it. And if your data isn’t perfect (which it never really is), your agent needs to know that. Let’s say you had an outage on a particular app at a certain point in time. Your agent needs to be able to account for that when interpreting the numbers. Precision about imperfection matters as much as the data itself.
Auto-generated context. Having metadata and definitions generated alongside your data is a massive convenience factor that becomes increasingly valuable as your data evolves. When definitions are auto-generated from the data models, they stay up to date as schemas change. This matters more and more as AI enables companies to move faster. Manual documentation can’t keep pace.
At Snowplow, we’re agnostic about where the semantic layer lives. If you’re on Snowflake, use Snowflake’s. Databricks, use Databricks', and so on. The most important thing though is that the context that feeds into this layer gets created and maintained over time.
This is where our approach is different from most data vendors.
Most data vendors generate data first and then try to understand what it means after the fact, reverse-engineering definitions from a dataset that already exists. Snowplow works the other way around, taking a shift-left approach to data.
We define the data before any of it flows. Event definitions are created first in Event Studio, and from those definitions we auto-generate the SDKs, schemas, validation rules, warehouse tables, and dbt models. Extending that to include semantic definitions is a natural part of the same process.
What does this look like in practice? We recently published a blueprint for enabling agentic analytics with Snowplow and Snowflake Intelligence that walks you through the process end to end. Within the blueprint, you get a semantic model template (a YAML file) that you can drop into Snowflake, adjust the table names and business context for your company, and point an Intelligence agent at it.
If you’re running Snowplow’s Unified Digital dbt package as part of our Digital Analytics data model pack and you have your business context documented, you can go from modeled behavioral data in your Snowflake warehouse to a working agent with accurate answers in about 15 minutes. Here's what that looks like once it's running in Snowflake Intelligence:
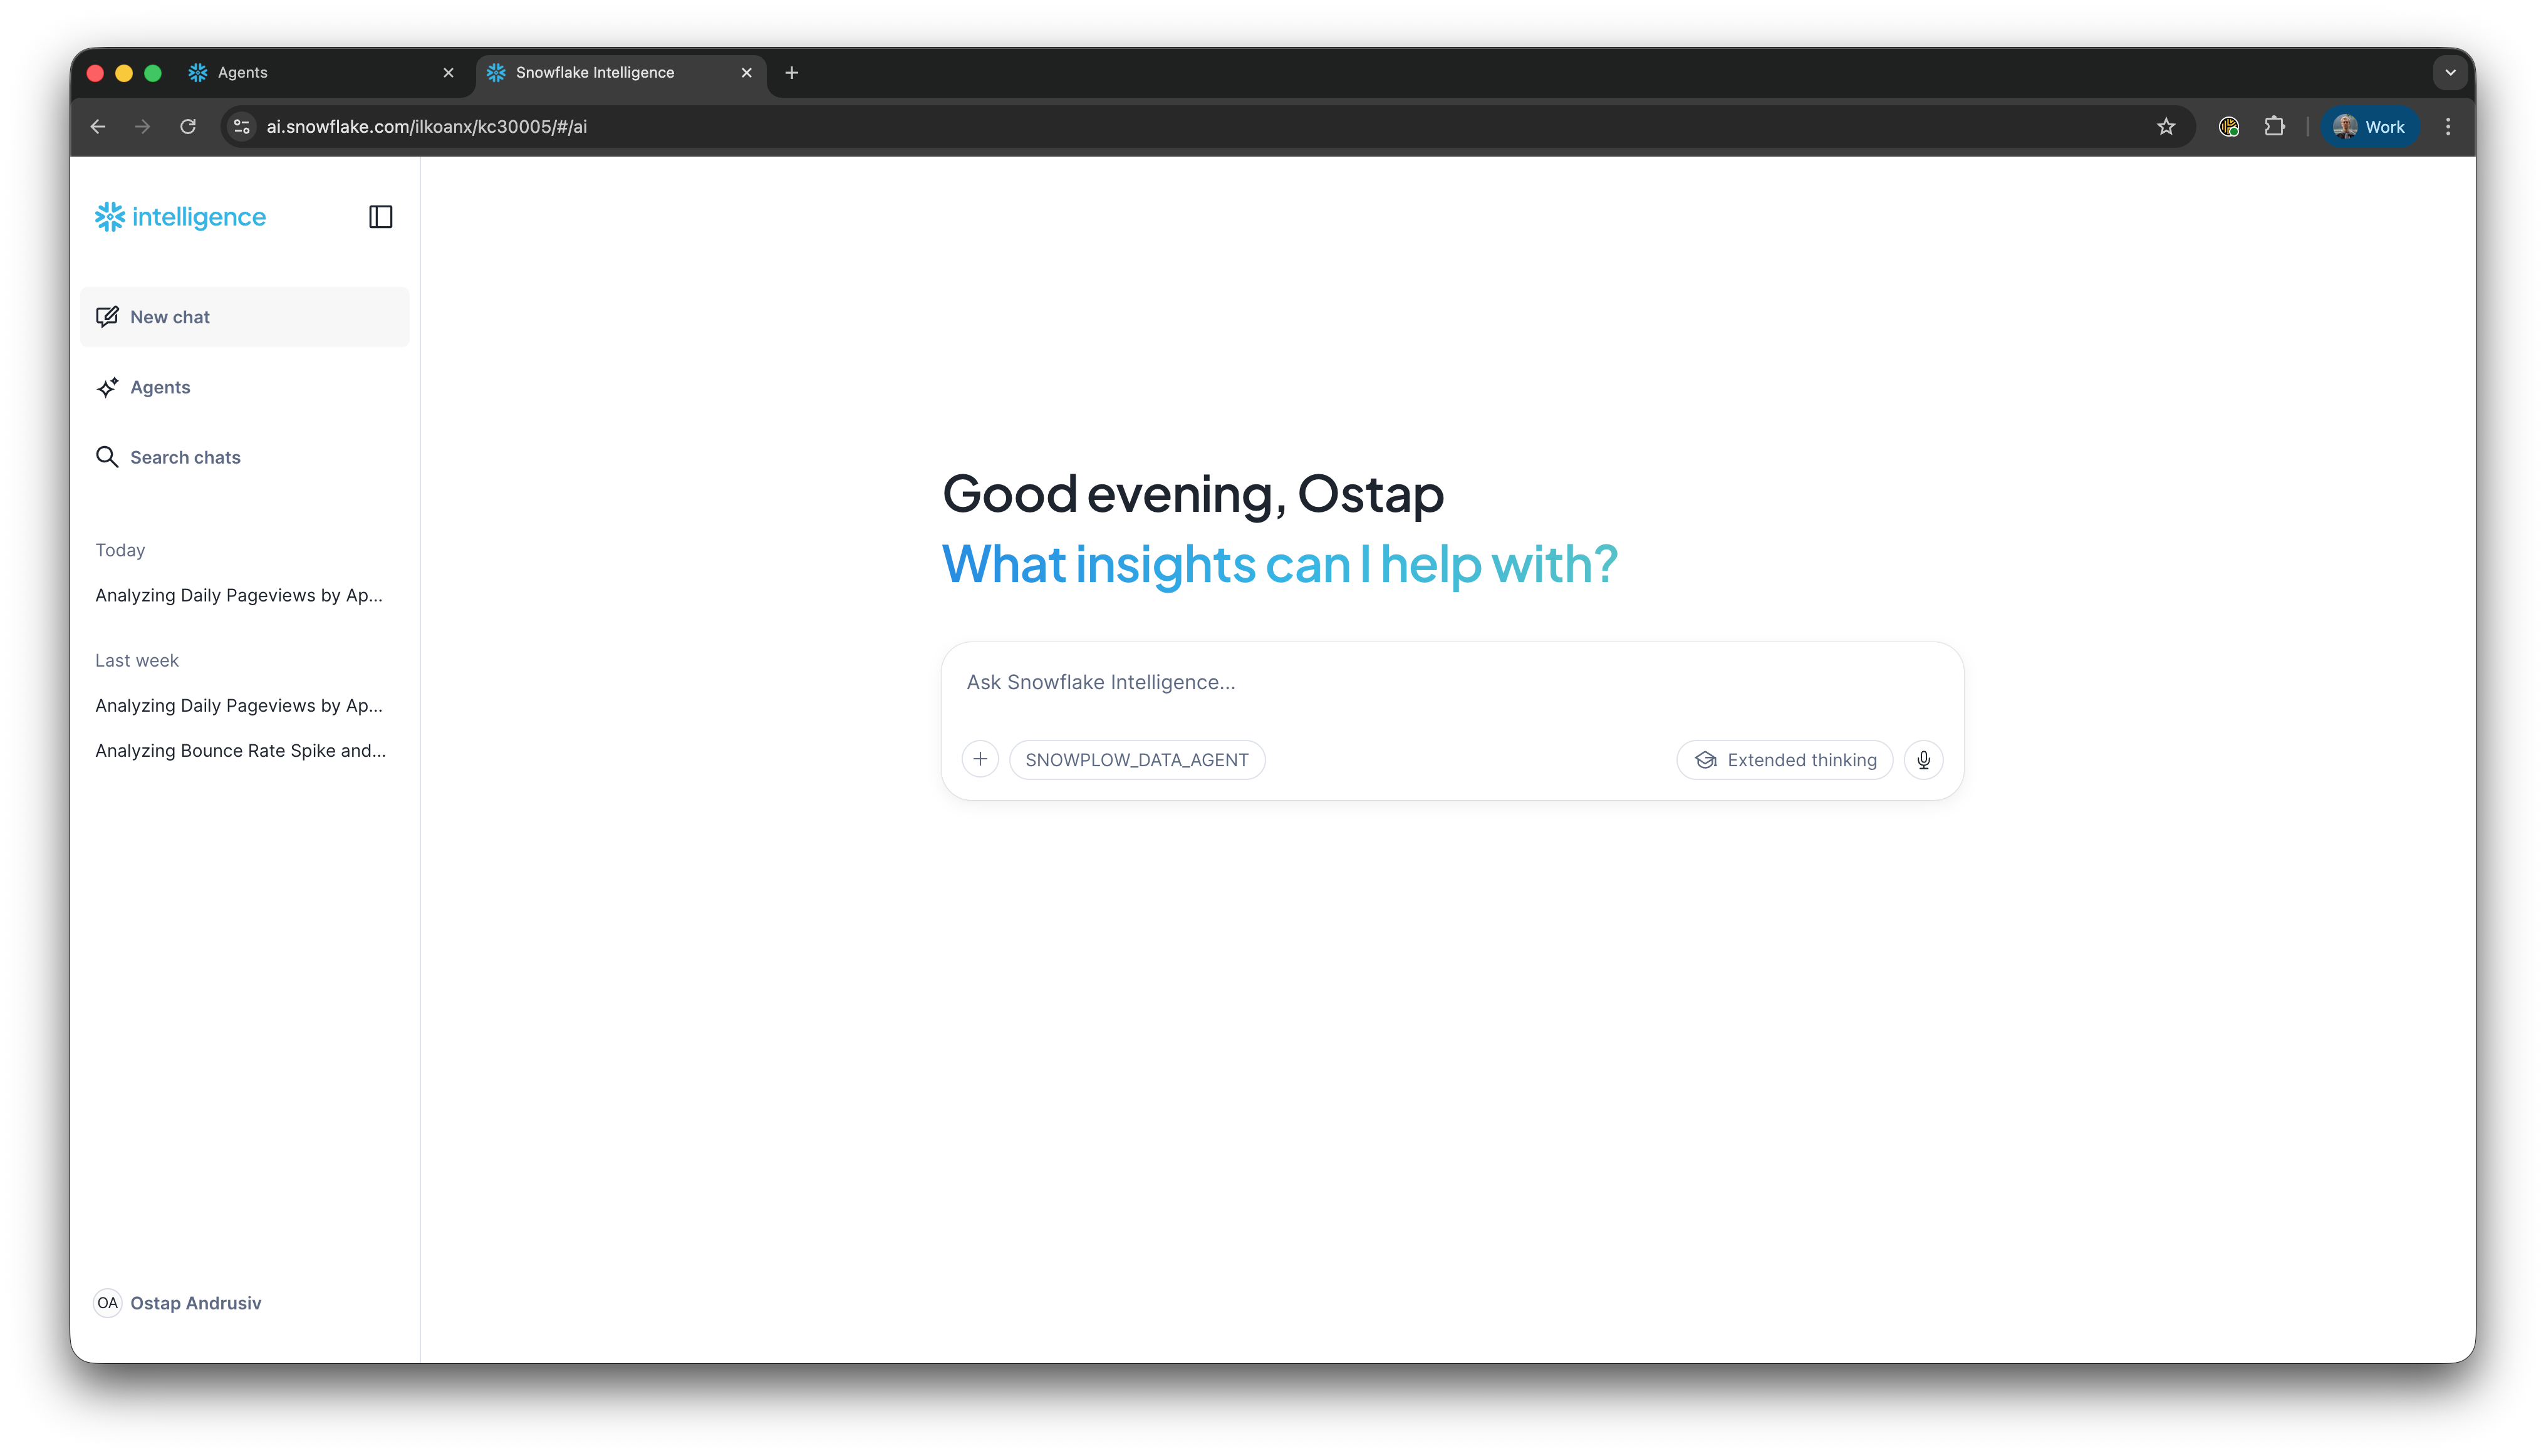
Step 1: Open Snowflake Intelligence
Step 2: Ask a question
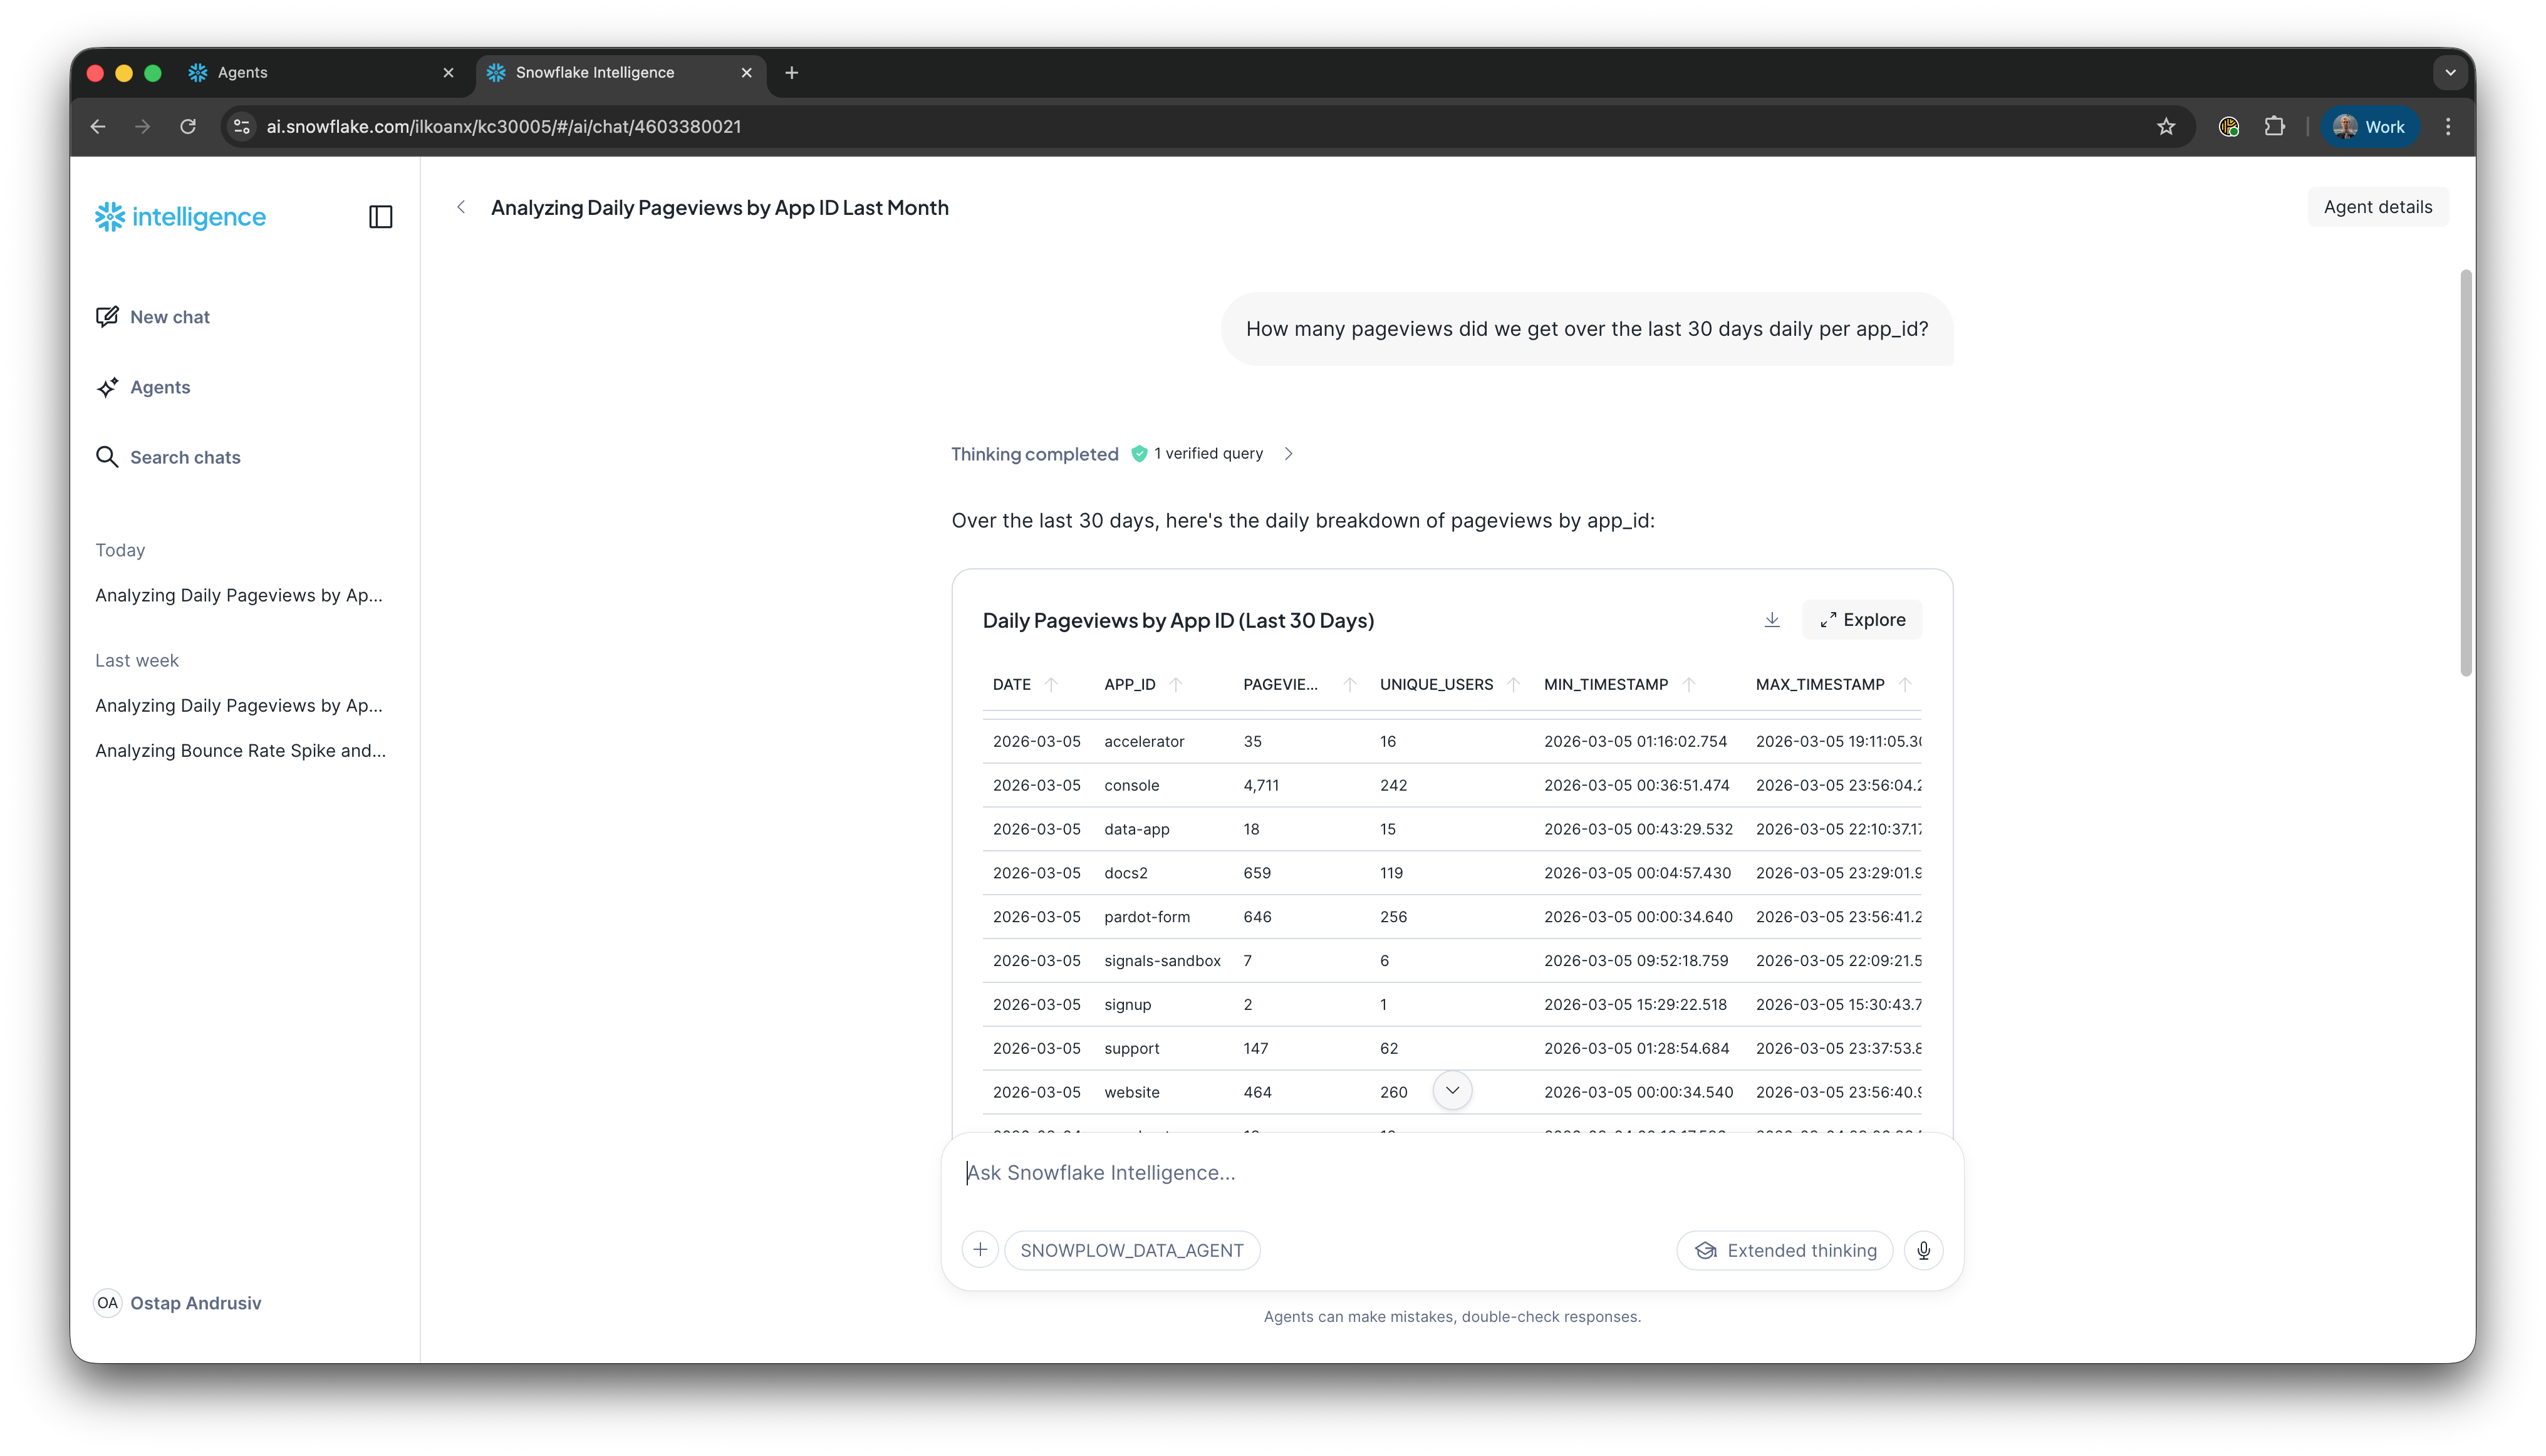
Step 3: View results as a table
Step 4: View results as a chart
That’s a Snowflake-specific example. But the principle applies wherever your semantic layer lives. Because Snowplow defines the data before it flows. The metadata and context travel with the data into whatever warehouse or platform you’re using.
Of course, the template approach will look different on Databricks or BigQuery, but the underlying advantage is the same. That is, you’re starting with data that already has context attached rather than reverse-engineering definitions from a warehouse full of tables you didn’t design.
If you want your agent to answer questions that combine Snowplow customer behavioral data with other data in your warehouse, that takes a bit longer. But the next step is straightforward. Add your business-focused tables to the semantic model so the agent can reason across both datasets. The point here is that you’re building on a foundation that already has its context attached, rather than starting from scratch.

The real comparison isn’t agentic vs. BI
To wrap things up, it’s important to note that dashboards aren’t dead. You still need them for KPI reporting, health checks, and the kind of structured monitoring that doesn’t require a conversation with an AI agent.
The comparison that really matters right now isn’t “should I use agentic analytics or traditional BI tools?” It’s “is my data foundation ready for either of them to work properly?”
If you put an agent on top of well-contextualized data, it will radically change how your team makes decisions. If you put it on top of messy, undocumented, poorly-modeled data, people will stop trusting it within a week. And the same is true for dashboards. The tooling may have changed, but the underlying requirement hasn’t.
If you’re exploring agentic analytics for customer behavioral data and you want to see what a well-contextualized setup actually looks like in practice, we’ve put together a step-by-step blueprint for enabling agentic analytics with Snowplow and Snowflake Intelligence. It walks through setting up a semantic view, creating an Intelligence agent, and getting to accurate, conversational analytics on your Snowplow data.
Frequently asked questions
What is the difference between agentic analytics and traditional BI tools?
Traditional BI tools like dashboards answer a predefined set of questions about what happened. Pivot tables offer more flexibility but require users to understand the underlying data well enough to explore it themselves. Agentic analytics uses AI driven agents to analyze data and answer open-ended questions through natural language. The real difference is that agentic tools can get you from "what happened" to "why" and "what should we do" — something traditional BI reporting tools struggle with.
Why do agentic analytics deployments fail?
Most failures come down to missing context, not bad models. Agents need two layers: a metadata foundation (the data that describes your data — tables, relationships, columns) and business context (how metrics are defined, what KPIs matter, what questions people actually ask). Without both, agents deliver confidently wrong answers.
What is a semantic model in analytics?
A semantic model is a curated layer that sits between your raw data and the tool querying it —whether that's a BI dashboard or an AI agent. It defines which tables matter, how they relate, and what the metrics mean. For agentic analytics, this typically means 4–8 well-modeled tables per business area, with clear definitions that the agent can use to write accurate queries.
Can you use dashboards and agentic analytics together?
Yes. Dashboards are still the right tool for KPI monitoring, health checks, and structured reporting. Agentic analytics is better for ad hoc questions, deep dives, and the kind of exploratory analysis that previously required a data analyst. Most teams will use both.
What data foundation do AI agents need to work properly?
At minimum: well-modeled tables, clearly defined metrics, high-quality data, and auto-generated context that stays up to date as schemas change. The more work you do upfront to define and contextualize the data, the less room the agent has to get things wrong.