
Observability vs monitoring for data pipelines
Data teams don’t have it easy. The Modern Data Stack is evolving at pace, but with each addition comes spiraling complexity and responsibility.
Staying on top of the number of failure points as well as maintaining organizational trust in data is the Mount Everest of jobs. Trudging on, like the badly equipped sherpas of the digital world, data teams are trying to ascend this ever-growing mountain with a self-drawn, wet, tattered map.
Adopting processes around data monitoring and observability can help you stay on top of the sheer number of failure points, as well as
- finding root-cause solutions
- preventing data downtime
- creating auditability
- improving data quality
This helps data teams feel more equipped to deliver value consistently, despite the growing complexity.
To show you how this works, we've made an observability and monitoring dashboard walkthrough
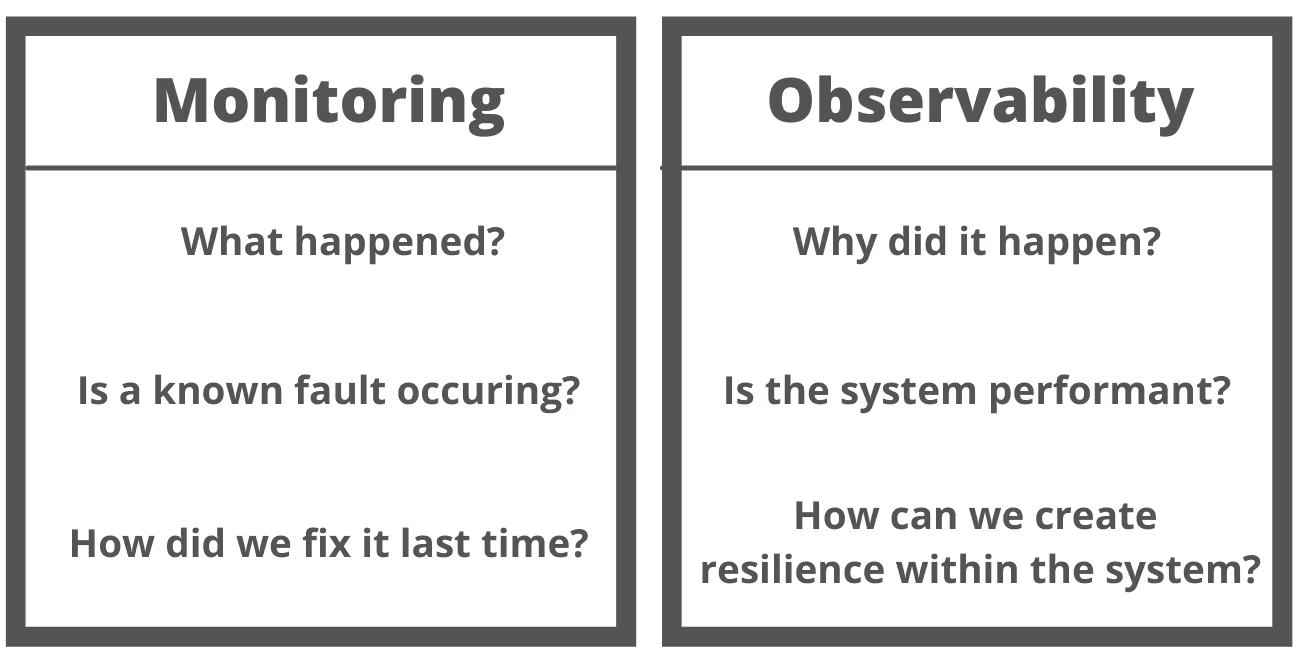
Observability vs monitoring
Observability is nothing new in software development, but for some reason, it has not migrated over to data platforms. Wayne Eckerson defines it as ‘the ability to monitor, predict, prevent, and resolve issues from source to consumption across the data pipeline’.
Monitoring is a subset of observability, with both being essential processes. I think about this distinction as two different factory employees, the monitor and the observer.
The monitor is a factory technician who knows the typical faults that come up with their machines and is constantly repeating the same repairs when something goes wrong. The moment that creak comes back in the usual place, the monitor is all over it.
It’s worth noting that these reactive repairs reduce but don’t prevent data downtime.
The monitor addresses the known unknowns.
The observer is a senior engineer who spends her day with a well-experienced eye on the factory’s central control panel. She knows the preemptive warning signs of errors in the system and is proactive in preventing breakdowns from occurring.
When a light flashes with a numerical value, she digs deeper to find the root cause of the problem.
Ultimately, she keeps the operation going day and night and can prevent costly downtime.
The observer addresses the unknown unknowns.
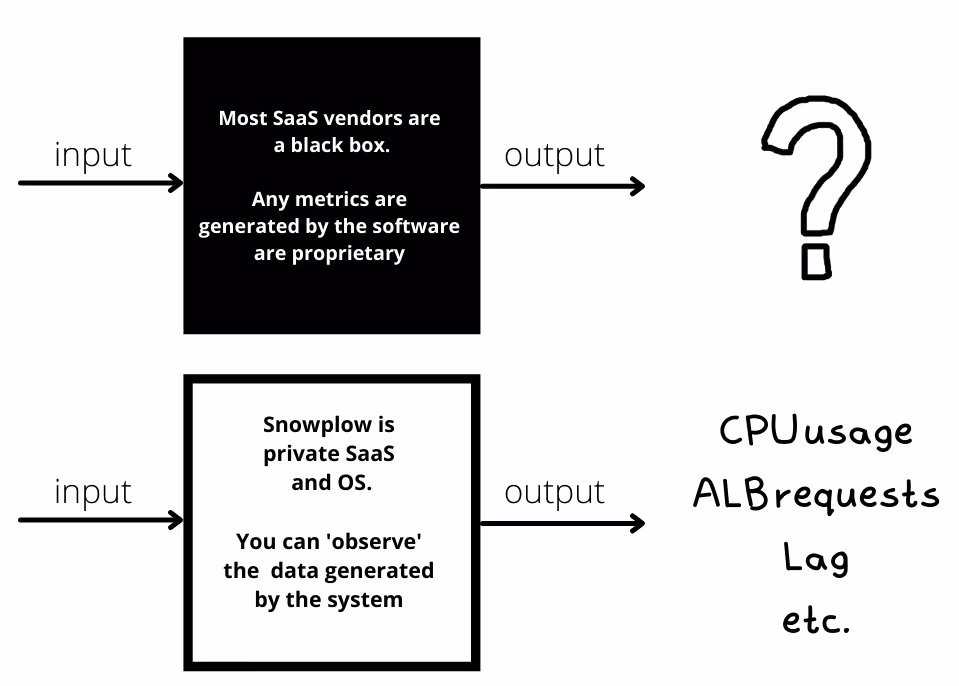
How is data-pipeline observability even possible?
Observability for your data pipeline is a direct result of our white box philosophy. Snowplow shows you the nuts and bolts of your behavioral data pipeline, which means you can learn from the data generated.
With our open source this is a given, but it also applies to our BDP product, which is fully transparent ‘private SaaS’. This model means the code lives entirely on your cloud and any exhaust from that system can be ‘observed’ accordingly. Much of this exhaust is a natural product of using cloud storage, such as AWS and GCP, but it can also be custom generated.
It’s worth noting that this functionality is available as a managed service in our BDP product, but it can be created and self-monitored with our OS offering.
Want to try the OS solution? Check out Snowplow OS Quickstart.
How exactly does Snowplow help you achieve observability?
The good news is that starting to assess the health of your service is an easy lift. With CloudWatch (AWS) and Stackdriver (GCP) you can quickly create your own observability platform based on the throughput of your Snowplow pipeline.
The core metrics we use to observe pipeline health are latency and event volume, which serve as the starting point for further testing (monitoring). Again, check out the walkthrough of the observability and monitoring dashboard to learn more.
How does Snowplow help you ‘monitor’ pipeline health?
The dashboard article linked to above details how you can observe your behavioral data pipeline and use monitoring to zoom in on potential issues.
If you detected a spike in event volume, for example, you could use monitoring to look at the event volumes at each stage in your pipeline, along with other metrics such as CPU usage, Resharding, and ALB requests. The same process is possible with latency.
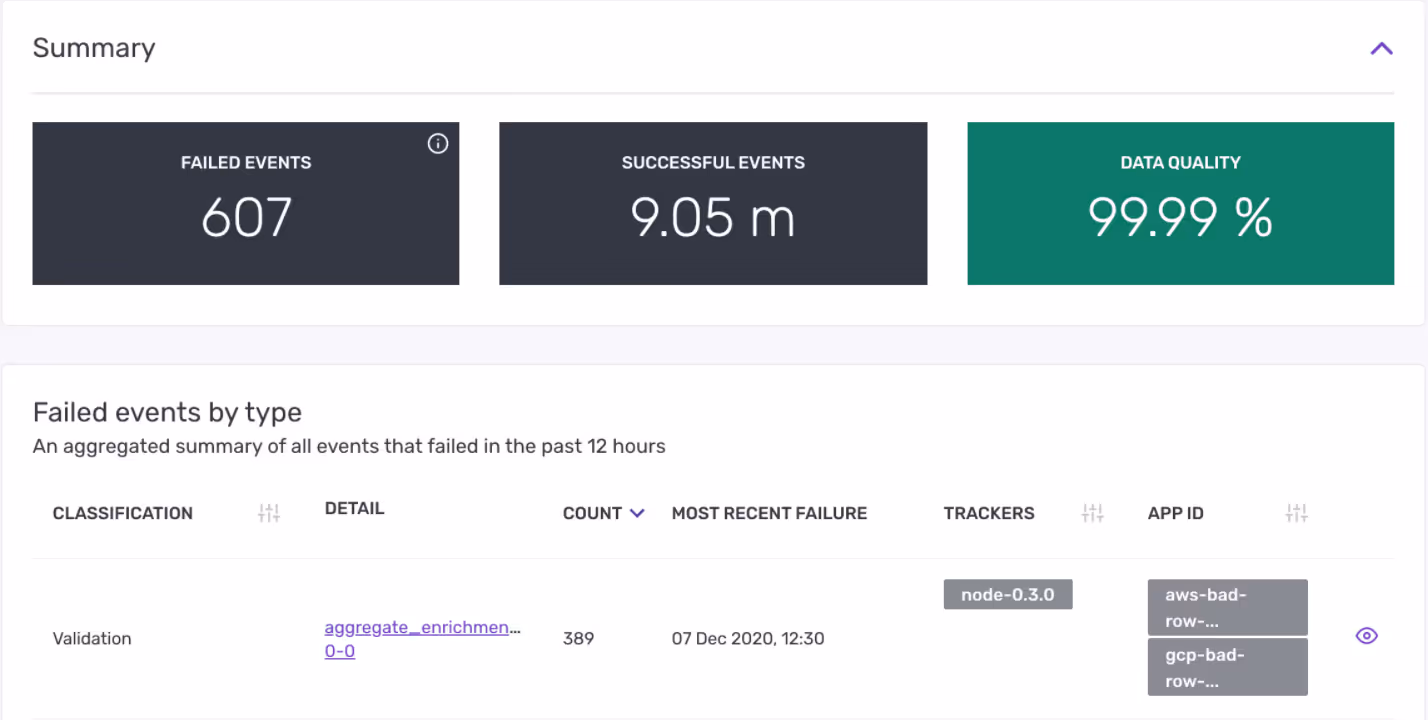
An extra layer of monitoring built into our design
Snowplow’s design permits a degree of data monitoring not possible with most other analytics tools, whereby you can assess the number of events that are failing validation before they even enter the warehouse.
This works by comparing the structure of events to a predefined JSON schema. Any event failing validation is held outside the warehouse until the error has been resolved.
This prevents many fundamental errors from occurring and insists that your data conforms to the structure you defined in the schema.
You can also filter failed events by type and fix issues immediately based on alerts.
Conclusion
Data observability assumes that there are unknown unknowns, but gives us visibility of the things that really matter. When we see the warning signals, we can investigate and resolve the issue quickly.
This is an ongoing process, as observability of a system as complex as a behavioral data pipeline is never going to be straightforward. That being said, we believe that the design of Snowplow’s open-source and private SaaS products gives our users a massive headstart in the race to provide truly reliable data.
Never tried Snowplow and want to experiment with data observability?