What is data latency and how to measure it
Data latency has turned into a key metric for data teams. It is becoming increasingly important as companies aim to execute on use cases that require real-time or near real-time data access. However, measuring and reporting on latency can be more challenging than most businesses anticipate, yet critical for data teams that need to deliver data fast to power time-sensitive use cases and analyses.
In this article we’ll explore what data latency is, why data teams should have transparency into latency metrics, and Snowplow’s approach to data latency reporting.
What is data latency?
Data latency is the time it takes for your data to become available in your database or data warehouse after an event occurs. Typically, data latency is measured in seconds or milliseconds, and ideally you measure latency from the moment an event occurs to the point where the data describing that event becomes available for querying or processing.
Not all use cases require low-latency data; higher latency is acceptable for use cases that don’t require real-time data, such as generating quarterly sales reports. However, more sophisticated use cases such as fraud detection or recommendation engines run on real-time or near real-time data, which makes low-latency a higher priority for data teams building out these types of products.
Data latency: why is it important?
As businesses strive to build more sophisticated data products, the requirement for faster data delivery becomes increasingly important. Examples of use cases that benefit from faster availability of data include:
- Balance supply and demand in a two-sided marketplace with the most up-to-date and accurate information
- Optimize the front page of a news site with breaking news stories
- Retarget customers in real-time who have abandoned their cart or interacted with an ad
- Make product or content recommendations taking into account users’ more recent actions
- Detect fraudulent or suspicious behavior in real-time
Each of these use cases benefit from having the data available faster, because real commercial value can come from the data being acted on more quickly. For example, the faster a marketplace can ensure there is sufficient demand for the supply available, the better the experience for suppliers (and buyers) on that marketplace. When a news site displays content on its front page that is highly relevant to the current news cycle, it increases the likelihood that readers will check back regularly throughout the day. And the faster a bank can spot potentially fraudulent transactions, the more it can minimize the cost of containing cases of fraud.
However, getting access to latency metrics is not always easy or straightforward, and most data delivery platforms do not provide access to this data. Nevertheless, there are a few approaches you can take to gather insights into your current data latency.
How to measure data latency
One way to measure and report on your data latency is to see how recent most of the data is in your database or data warehouse. However, this provides a very crude measurement since it might not factor in late arriving data. Alternatively, you can look at how far through a stream a microservice has processed, but this method is difficult to translate into a time measurement that is easy to understand or report on.
On the other hand, the most straightforward metric would be the time it takes the data to get processed and written to the storage target in question. If a business has access to this data, it could surface how fast behavioral data loads into the database or warehouse, report on the latency with greater certainty, and have more transparency into the accuracy of their data products.
Snowplow’s approach to data latency
At Snowplow, one of our key values is transparency, which includes giving customers the ability to surface reporting around data latency so you can have greater confidence and certainty around your pipeline and data products. For this reason, we have been updating our microservices to make it possible for customers to measure data latency consistently and accurately. With Snowplow you can see how fast your data loads into your data warehouse or database. More specifically, Snowplow:
- Compares the current time of each event (when the event is processed) with the time the event hit the start of the pipeline (collector_tstamp).
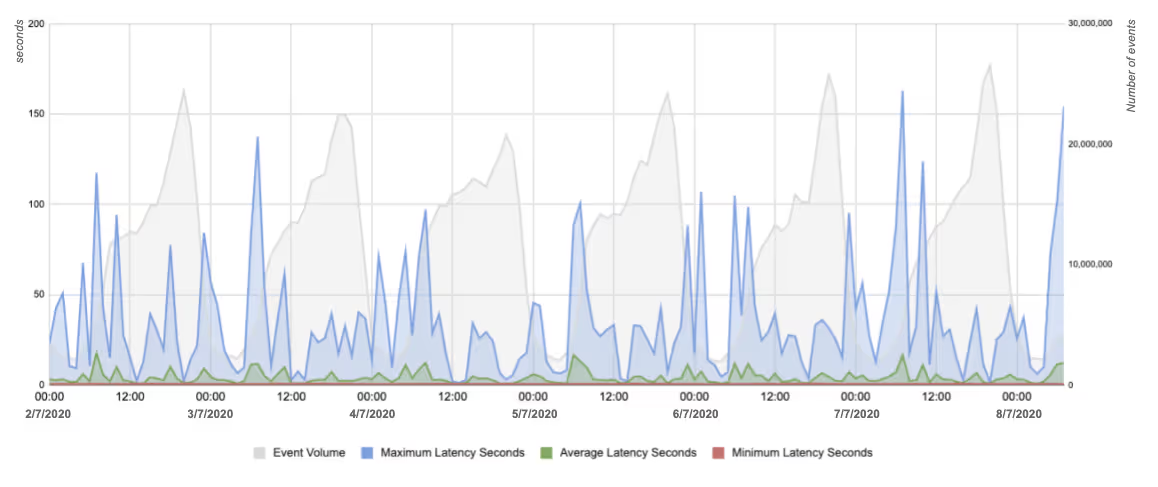
- Measures the min, max and average lag in each time period making it possible to track the performance of the pipeline over time and how the lag has changed due to traffic volatility.
- Publishes the data to Google Cloud’s Operations (formerly Stackdriver) and Cloudwatch, so it is available to customers as well as our team.

Example of data latency metrics generated by a Snowplow customer
As a result, this makes it easy to understand the health of your pipeline and see how fast data is being loaded into each storage target. Data latency metrics are already available for the BigQuery Loader, and this feature will be extended to our other microservices as well.

