
(Human) Attention is All You Need
A look at measuring engaged time with Snowplow
Snowplow is a great tool for collecting behavioral data. It allows you to easily and efficiently gather a robust set of data on your users that can be used to derive all sorts of meaningful insights.
However, even with a tool like Snowplow, there will always be an unavoidable air gap between the mind of the human user themselves and the device with which that user is interacting with your application.
Sometimes that discrepancy can be waived away as insignificant. Other times that gap can have a huge impact on your organization's KPIs, or even revenue.
In this post, we will explore how to navigate this issue. We’ll also look at how our most successful clients think about user engagement and engaged time to make meaningful data-driven decisions.
So who should actually care about this?
When tracking with an eventing framework, it can be useful conceptually to classify a user’s behaviors into one of two categories: intentional or engaged.
–An intentional action is something that the user wants to do, so they use their device to make it happen. For intentional actions, the origin of the behavior starts with the human in the chair (eg “I want to check my bank account balance”) and then they use the cold silicon of their laptop to achieve it.
–Engaged behavior flows the other way. There is content that a publisher makes available on their application.The publisher is then incentivized to get as many people as possible to spend as much time as possible engaging with that content.
In this scenario, the content in question, say a newspaper, originates from the light up screen of the device and proceeds into the eyeballs of the human at the other end, imprinting their ideas onto the user (likely along with some advertisements or subliminal product placement references)
As a tool, Snowplow and eventing technologies are nearly flawless at providing information about users' intentional behaviors. This is because those behaviors must flow through the device. If I want to go down the page, I need to scroll on my machine, and I can track that scroll perfectly using the very same computer that is doing the scrolling. Seamless.
However, until our devices can literally detect whether we're paying attention—and pause an ad if our eyes aren't glued to the screen—there will always be some uncertainty around that final step of measuring engaged behavior. Sure, the light from my device is displaying the newspaper article, but is the actual human on the other end really reading it? Did they get up to make a coffee? Have they been gone for months and just never close their tabs?
If your application involves frequent user interaction, this might not be a concern for you. If you run an ecommerce site or host a video game, you probably have access to lots of easily tracked intentional behaviors as your users browse, buy, and shoot magical arrows, all of which give you a firm sense that they are actively engaged with your application.
But as you extend into longer-form content, the engagement level of a user becomes less and less clear.
If a desktop user stayed on an article for 8 minutes without scrolling, does that mean they read the whole thing in 8 minutes? Or did they read it in 3 minutes and spend 5 going for a walk? Or did they read none of it?
It’s hard to tell, and this problem is only exacerbated by the fact that organizations that have the most trouble answering these questions accurately also tend to have revenues or business metrics directly tied to their answers.
In an ecommerce store, it doesn’t matter how long the user spends on the site as long as they eventually buy something. But for media publishers whose revenue comes from advertisers, I need to convince those advertisers that lots of real human eyeballs are gobbling up my articles.
Advertisers don’t want to display ads onto abandoned computer screens while the humans behind those screens frolic about outside.
Sounds like a hard challenge — let’s talk about Absolute Time
Even with a world class behavioral data tracking solution like Snowplow, closing the gap between the device and the engagement of the user behind it can be tricky. Therefore, before even starting to try to do so, it is worth checking your assumptions and asking yourself; ”Is there a quick, easy, and imperfect way for me to understand how much time my users are spending on my application that’s still good enough for my business needs?”
Depending on your use case, there can be! Assuming you have designed into your eventing framework a good way of “Sessionizing” your data (which we are going to assume you do, because, if not, we could write multiple novels about that topic) Snowplow has a handy metric that is available to you right out of the box: Absolute Time
Absolute time tends to be a simple thing to calculate, and it can provide a pretty good estimate for how long a person is spending on your site. At snowplow, we define this simply as:
Absolute_Time = 𝚫(Last_Event_In_Session_Timestamp, First_Event_In_Session_Timestamp)
Where:
– First_Event_In_Session_Timestamp: Is the timestamp of the first event seen in the session
– Last_Event_In_Session_Timestamp: Is the timestamp of the last event seen in the session
Returning to our ecommerce example: if my primary concern is whether a user made a purchase, but I’m also somewhat interested in the site’s navigability, then absolute time could be a reasonable metric to consider.
Perhaps when I study it, I see that there are 2 clear groups of users that come to my site, a group that is in and out very quickly and another group that spends more time.
The interpretation of that pattern will require another layer of analysis (It’s possible that some users come to my store knowing exactly what they want. Others may prefer to browse. Certain products may be easy to find, while others are hidden and require deeper searching).
Whatever the reason, using Absolute Time, while inexact, has uncovered a pattern. I don’t need to waste more time breaking that metric down any further. I can see there are 2 clear groups, and now I have to figure out how I want to use that information to make my application better.
However, the limits of this metric should also be apparent after even a little bit of deeper thought. Absolute time is a “dumb” metric with no nuance baked in. If you use it as an estimate for user engagement, you are automatically assuming that all users of your application are paying full attention the entire time they are on your app. Often this assumption does not hold and we need a smarter metric. However, there are cases when this assumption is not as wrong as you might first believe.
If left to my own devices (get it?), should I use Absolute Time as a metric?
Think about what it actually takes to view a piece of content on your mobile device. For starters, we need to physically hold the phone up to look at it, which requires effort.
We are also subconsciously aware that as we interact with our phone, the battery is draining, and we have all become pretty good at instinctively optimizing the battery life of our devices, locking them as soon as they are not in use.
Locking your phone is also something we do as a good security practice, as leaving a phone unlocked is opening the door for someone to get into all of your personal data. Further, most phones only allow one application to be on screen at a time, limiting the number of other things we could be doing at any given time.
Lump those facts together, and you can make a strong argument that the following assumption is true for mobile devices:
If an application is on-screen on a user’s mobile device, the user is actively engaging with that application
While this assumption doesn’t always carry over for web (which we will discuss below), accepting it as true can massively simplify how you measure user engagement for your mobile applications.
Snowplow has adopted this assumption to be true in its pre-built data model packs (specifically the Unified Digital Model), and has built an engaged time metric around it.
To calculate this engaged time metric, we start with the Absolute Time metric from above, understanding that we might need to think a little more about how we’re grouping our mobile events together (does a session end any time a user moves our app to the background? Or can a user maintain a session if they flip to another app and come back to ours? At Snowplow, we generally assume the latter that the session can and should continue if the user quickly returns, but this is configurable). We also calculate it very slightly differently as:
Mobile_Absolute_Time = ∑ screen_summary.foreground_sec + screen_summary.background_sec
Where:
– screen_summary.foreground_sec: value (in seconds) from the screen summary entity found on screen_end events where the screen was in the foreground of the device
– screen_summary.background_sec: value (in seconds) from the screen summary entity found on screen_end events where the screen was in the background of the device
This slightly different methodology leads to the same result as our previous Absolute Time calculation.
With our events grouped how we want and our Mobile Absolute Time calculated, all that is left is to calculate how much of that was engaged time. Because engaged time is any time the application was on screen, and Snowplow captures on-screen time out-of-the-box (OOTB) for both iOS and Android in the Screen_Summary entity of each end_screen event, the calculation becomes a simple sum:
Mobile_Engaged_Time = ∑ screen_summary.foreground_sec
Where:
– screen_summary.foreground_sec: value (in seconds) from the screen summary entity found on screen_end events where the screen was in the foreground of the device
For example, if I have 3 screen_end events that appear in my warehouse as follows:
Enough stalling, talk about web!
Ok look, on a browser presenting content to a person, the assumption that the user is always looking at that content simply doesn’t hold up.
The user could be doing any number of other things. They could be looking at a different screen, looking down at their phone, or they might not even be in the room at all.
To confirm that an active user is at least somewhere in the vicinity of the computer showing your content, you need a signal of activity you can measure, and that activity is going to come from input devices: keyboards and mice.
Specifically, Snowplow looks at the following inputs that a user might provide to a web page:
If any of these actions can be detected, then we know that the user is actively interacting with the application and can be considered engaged.
Detecting these actions is easy. However, interpreting these and translating them into periods of engaged and non-engaged time can be challenging. Fortunately, Snowplow has a smart method for doing just that.
Getting to the heart(beat) of the matter - the infamous Page Ping event
Let’s imagine that you have a 60 second period of time where a user is on your site.
Over the course of that 60 seconds, that user provides a series of inputs we can detect as described above. Except they are random and scattered.
How do we translate that into an understanding of how much of that 60 seconds should be considered “Engaged”. And how much should we discount and assume the user decided to crawl under their desk to retrieve their favorite fidget toy after dropping it, ignoring our application and its beautiful advertisements?

Well, one logical thing to do would be to break the period of time up into smaller chunks. Then, for each of those chunks, we could check to see if the user gave us input of any kind since the last chunk.
If yes, we can assume that the user was active during that chunk, and assign the chunk as “engaged”. If not, we can assume they were not engaging with the application, doing any number of other things instead.
This is exactly how Snowplow’s Page Ping events work. The Snowplow tracker listens for any input from the user (from the actions listed above), and every X seconds (10 in our diagram) it performs a check to see if any input was detected. If yes, it fires a page ping event. If not, the tracker will not fire a page ping event
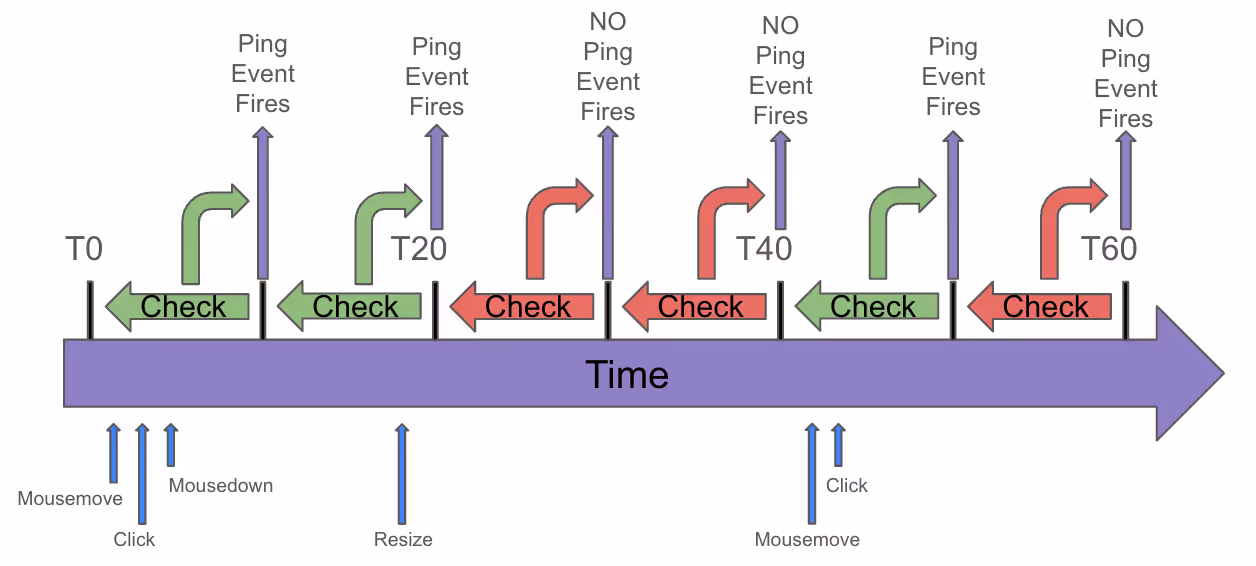
So, we’re getting closer to a much better engaged time estimate! In the above diagram, we have 60 seconds of time over which we generated 3 page ping events.
If we are checking for activity every 10 seconds, that means those 3 page pings equate to 30 seconds of engaged time out of a possible 60 seconds of absolute time.
We still need to think about how to handle the beginning and end of this time period, as there are some significant nuances at either end of this big purple arrow.
But first, let’s head off some common questions about page pings.
Not granular enough! Computer - ENHANCE!
With Snowplow, the time period between page ping events is entirely customizable (via the heartbeatDelay config option in your tracker)
One of the first instincts nearly everyone has when learning about this is to ask “can I shorten the gap between page pings to get extremely accurate measures of engaged time? And while you certainly CAN do that, there are 2 main reasons why you almost certainly don’t want to:
1. Logarithms: Even if we assume that shortening the gap between pings gets you more clarity (which we will see in the next point is not true), look at the picture above.
To break 60 seconds into six 10 second chunks we needed 6 checks, and would have needed to generate potentially up to 6 page ping events.
If we wanted to cut that gap in half, we would need to double the checks and potentially go up to 12 pings.
To cut the period in half again we would need to double again to 24. Every time we want the same benefit of cutting the granularity of the time period in half we need to double the previous number of checks. That means the benefit we get is scaling logarithmically, which is bad.
Although events are very cheap to process in Snowplow, they are not totally free (thinking about infrastructure and downstream querying later in the warehouse), and each page ping on its own is generally low-value. Consequently, the more pings we generate, the more we end up paying to process them and the less benefit we get from each one.
2. Reading: It is also possible to be fully engaged with an application without providing an active input - even if we can’t directly measure it.
This case is especially true if you have long form content where a user will be reading. Therefore, shortening your time between pings too much can cause you to over-emphasize direct input from the user.
This can be just as inaccurate as assuming the user is engaging when they are really out for a walk. You need to extend the user’s input out into some stretch of time, otherwise you will end up throwing out any period where a user isn’t actively wiggling their mouse.
In general, the default Snowplow value of 10 seconds between page pings is a pretty good compromise.
Organizations that stretch it out to something like 30 seconds can reduce their event volumes considerably with only a slight hit in accuracy, while organizations that drop their interval to 5 seconds (or god forbid, 1 second) tend to suffer under the weight of a lot of low-value events without much increase in accuracy to show for it.
Think carefully about if you have a real reason for departing from the default 10 seconds, or if you are just changing it because it “feels right”.
The final stretch, how to account for the beginning, end, and off by 1 errors
SO, we know that we can calculate engaged time by multiplying the number of page pings we ended up generating by the time intervals we were measuring. This already gives us a good estimate, however, we can do a little bit better.
Specifically at the beginning of a new page view, problems can arise if we decide to start firing page pings as soon as the page loads.
To account for this, Snowplow provides another configuration: minimumVisitLength that you can set to prevent pings from firing for the first X seconds when a user visits a page.
How long you want to wait to fire pings is up to you, and there are arguments to be made for setting this number quite high (e.g., 30 seconds) or very small (e.g., 1 second).
For calculating engaged time, however, Snowplow’s OOTB model will assume that each user that visits a page will have been engaged on that page for the full minimumVisitLength. So, if engaged time is an important metric, a smaller value is generally better.
At the end of the time period in question, it is generally assumed that a small amount of potential engaged time may be lost at the end of the time period when a user exits an application.
This issue arises if a user ends their session after 67 seconds, the check that would have fired a page ping for T60 - T70 never has a chance to fire.
Snowplow considers this time loss negligible assuming your page ping intervals are sufficiently small. However there have been instances of organizations firing custom events whenever the application is exited and rolling that lost time back in with custom logic.
Finally, looking back at our sample minute:
As you can see, to define this period of time we actually need 7 marks to denote 6 increments of time. Like classic computer scientists, that means for our final calculation we will need to control for this by subtracting 1 from our page ping count (For those curious, what we are going to be doing is replacing the mark under T0 with the value from minimumVisitLength, which we assume is always a period of engaged time. From that point on, every ping will represent the 10 seconds that came before it accurately).
At last: Our final calculation:
We now know more about time on the web than we ever wanted to, and it is time for Snowplow’s final formula for calculating engaged time. Snowplow calculates user engaged time on web for a single page visit as the following:
Web_Engaged_Time = minimumVisitLength + ((Count(Page_pings) -1) * heartbeatDelay)
Where:
– minimumVisitLength= value (in seconds) you set in your tracker indicating how long the tracker should wait before firing page pings
– Count(Page_pings) = How many page pings occurred over the period you are measuring
– heartbeatDelay = The time (in seconds) between each page ping as set in your tracker
And that’s it. To extend this formula over a session, or the lifetime of a user it is as simple as adding the output of this formula up over the session/ user lifetime.
Parting Thoughts:
Thanks for going on this journey through the land of measuring time on the internet. As we can all now appreciate, finding a metric that effectively encapsulates user behavior is a more difficult, nuanced topic than simply starting and stopping a digital stopwatch.
Before any successful effort to distil these measurements down into valuable insights for your business stakeholders can begin, you and your organization need data to drive them. Snowplow’s flexible event capture platform is perfectly suited to provide the raw, transparent data you need for anything from simple metric calculation all the way up through advanced ML/AI use cases.
Whether you agree with and want to align with the recommendations and calculations outlined above, or you have a completely different view and want to strike out on your own path, Snowplow's fully customizable approach to eventing and data capture can support you and provide the data to power whatever approach you choose.
If you have any questions or would like to discuss anything here, please don’t hesitate to reach out to Snowplow. We’re a bunch of data nerds who love talking about this stuff so don’t be shy, we would love to hear from you.