Debugging bad data in Elasticsearch and Kibana – a guide
One of the features that makes Snowplow unique is that we actually report bad data: any data that hits the Snowplow pipeline and fails to be processed successfully. This is incredibly valuable, because it means you can:
- Spot data tracking issues that emerge, quickly, and address them at source
- Have a corresponding high degree of confidence that trends in the data reflect trends in the business and not data issues
Recently we extended Snowplow so that you can loadbad data into Elasticsearch. In this guide, we will walk through how to use Kibana and Elasticsearch to:
- Monitor the number of bad rows
- Spot problems that emerge
- Quickly diagnose the route causes of the issues, so that they can be addressed upstream
The Kibana discover UI: a great interface for diagnosing bad data
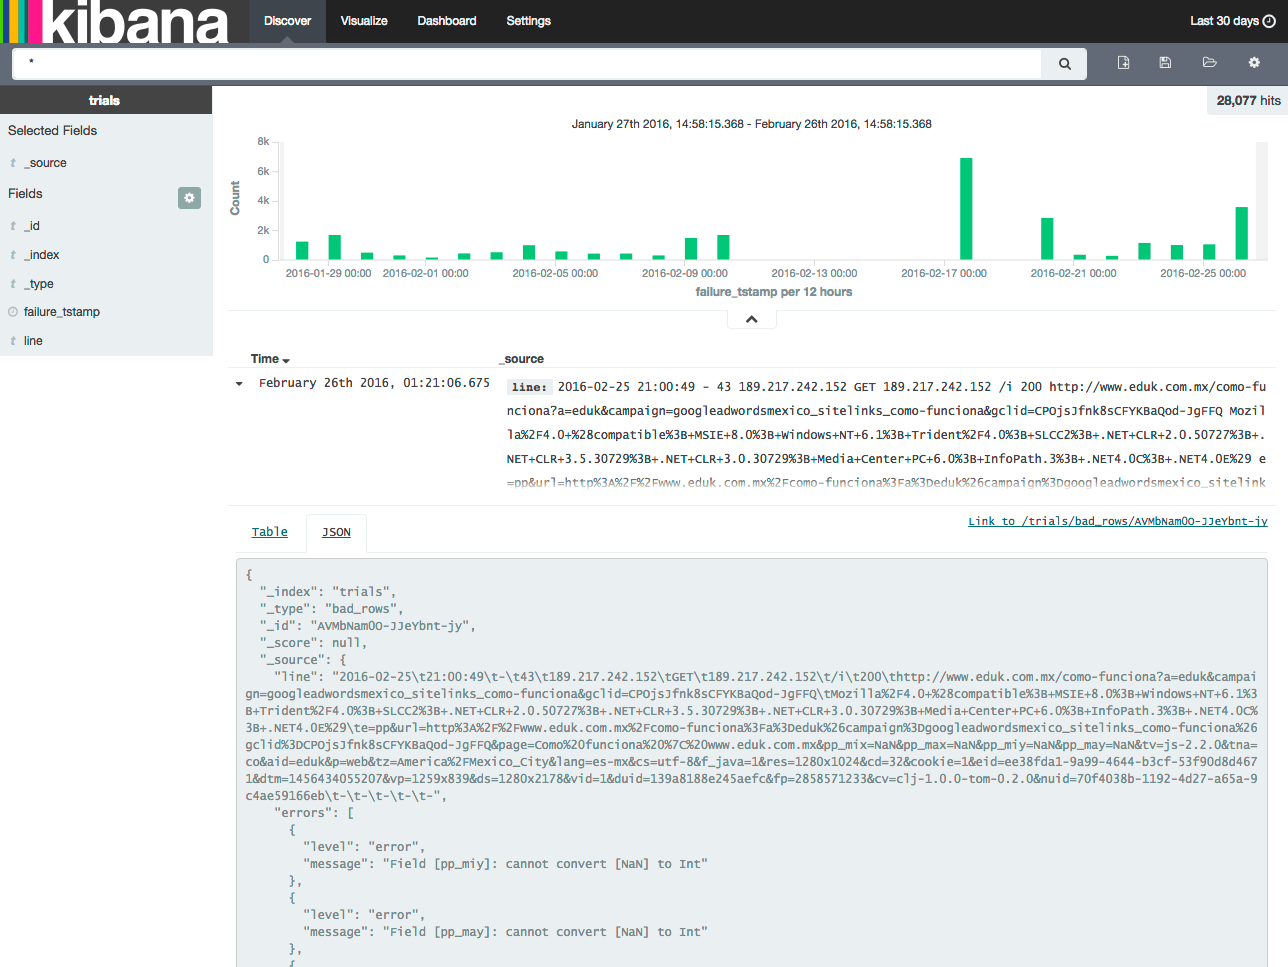
The Kibana discover interface provides a great UI for debugging your bad rows.

On the top of the page we have a graph showing the number of bad rows per run. Underneathe we have a selection of data, and the ability to drill in and explore any of them in more detail:

Pick your time horizion
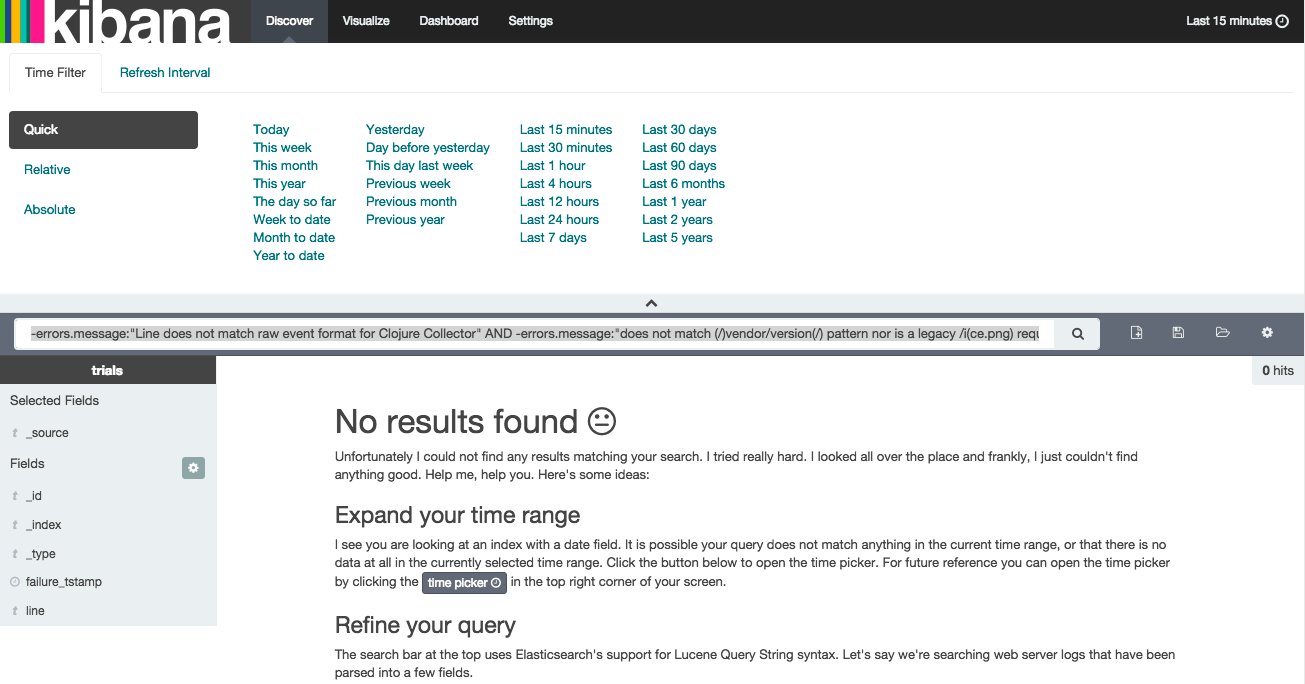
The first thing to do is choose the time horizon you want to look at your bad rows over. By default, Kibana will load with a time horizon of only 15 minutes. It can be useful to look at bad rows over a much longer horizon. By clicking on the top right corner of the screen we can select the time period to view:

We then select to look at 30 days worth of data:

Filtering out bad rows that we need not worry about
One of the interesting things that jumps out when you monitor the bad rows is that there is a fair amount of data that is generated not by Snowplow trackers or webhooks that fail to process (which mean lost data) but data that is generated from malicious bots pinging the internet looking for security vulnerabilities. The below is an example:
{ "_index": "trials", "_type": "bad_rows", "_id": "AVMGmhGmO-JJeYbnt6nW", "_score": null, "_source": { "line": "2016-02-21t11:59:46t-t13t38.122.189.10tGETt38.122.189.10t/admin/t404t-tMozilla%2F5.0+%28Windows+NT+5.1%3B+rv%3A9.0.1%29+Gecko%2F20100101+Firefox%2F9.0.1t&cv=clj-1.0.0-tom-0.2.0&nuid=-t-t-t-t-t-", "errors": [ { "level": "error", "message": "Request path /admin/ does not match (/)vendor/version(/) pattern nor is a legacy /i(ce.png) request" } ], "failure_tstamp": "2016-02-22T01:18:55.508Z" }, "fields": { "failure_tstamp": [ 1456103935508 ] } }That was a request to our trial-collector.snplow.com/admin. The next request was generated by a bot trying to ping trial-collector.snplow.com/freepbx/admin/changes:
{ "_index": "trials", "_type": "bad_rows", "_id": "AVMbNW2mO-JJeYbnt9_e", "_score": null, "_source": { "line": "2016-02-25t16:12:14t-t13t104.192.0.18tGETt104.192.0.18t/freepbx/admin/CHANGESt404t-t-t&cv=clj-1.0.0-tom-0.2.0&nuid=-t-t-t-t-t-", "errors": [ { "level": "error", "message": "Request path /freepbx/admin/CHANGES does not match (/)vendor/version(/) pattern nor is a legacy /i(ce.png) request" } ], "failure_tstamp": "2016-02-26T01:20:30.114Z" }, "fields": { "failure_tstamp": [ 1456449630114 ] } }As these bad rows do not represent data that we want but failed to process, we can safely ignore them. To do that, we simply filter these out by entering the following query in the Kibana search box at the top of the screen:
-errors.message:"does not match (/)vendor/version(/) pattern nor is a legacy /i(ce.png) request"
This removes all rows that represent requests to paths that the collector does not support.
Another bad row that you need not worry about are rows like the following:
{ "_index": "snowplow", "_type": "bad_rows", "_id": "AVM7XuqOi4wlDuAN6icW", "_score": null, "_source": { "line": "2016-03-02t19:00:47t-t-t66.249.73.212tOPTIONSt66.249.73.212t/com.snowplowanalytics.snowplow/tp2t200thttps://www.oneflare.com.au/pet-boarding/nsw/kogarahtMozilla%2F5.0+%28compatible%3B+Googlebot%2F2.1%3B+%2Bhttp%3A%2F%2Fwww.google.com%2Fbot.html%29t&cv=clj-1.1.0-tom-0.2.0&nuid=-t-t-t-t-t-", "errors": [ { "level": "error", "message": "Unrecognized event [null]" } ], "failure_tstamp": "2016-03-03T07:02:46.465Z" }, "fields": { "failure_tstamp": [ 1456988566465 ] } }They are caused by OPTIONS requests that are made when users of the Javascript tracker send data via POST. (It is necessary for the browser to send an OPTIONS request prior to issuing the POST request with the actual data – this is a CORS requirement.) Again, they can safely be ignored as they don’t represent failed attempts to send data: they represent a necessary step in the process of sending data from the Javascript tracker to the collector. We can filter these out, with the bad rows generated by malicious bots, using the following query in Kibana:
-errors.message:"does not match (/)vendor/version(/) pattern nor is a legacy /i(ce.png) request" AND -errors.message:"Unrecognized event [null]"The remaining rows should all be geniune bad data i.e. data generated by the trackers or webhooks, so we need to drill into what is left and to unpick the errors.
Diagnosing underlying data collection problems
Now that we’ve filtered out bad rows that we need not worry about, we can identify real issues with our tracking.
I recommend working through the following process:
1. Identify the first error listed
Inspecting the first error, we might find something like the following:
{ "_index": "trials", "_type": "bad_rows", "_id": "AVM6GgdzjhxDf3--euL0", "_score": null, "_source": { "line": "2016-03-02t15:55:51t-t-t216.220.120.131tPOSTt216.220.120.131t/com.snowplowanalytics.snowplow/tp2t200t-tCanary%2520Staging%2F7834-andrew%252FCA-3914+CFNetwork%2F711.3.18+Darwin%2F14.0.0t&cv=clj-1.0.0-tom-0.2.0&nuid=6096f700-e26f-4b65-a81c-04317c179b75t-t-t-tapplication%2Fjson%3B+charset%3Dutf-8teyJzY2hlbWEiOiJpZ2x1OmNvbS5zbm93cGxvd2FuYWx5dGljcy5zbm93cGxvd1wvcGF5bG9hZF9kYXRhXC9qc29uc2NoZW1hXC8xLTAtMyIsImRhdGEiOlt7InZwIjoiNjQweDk2MCIsImVpZCI6Ijc0MjBlYzIzLWZjNzEtNGUzNi05OTc3LTdhZTBjNDBkYmU1NSIsInVpZCI6IjgwODUiLCJwIjoibW9iIiwiY3giOiJleUp6WTJobGJXRWlPaUpwWjJ4MU9tTnZiUzV6Ym05M2NHeHZkMkZ1WVd4NWRHbGpjeTV6Ym05M2NHeHZkMXd2WTI5dWRHVjRkSE5jTDJwemIyNXpZMmhsYldGY0x6RXRNQzB4SWl3aVpHRjBZU0k2VzNzaWMyTm9aVzFoSWpvaWFXZHNkVHBwY3k1allXNWhjbmxjTDJGd2NHeHBZMkYwYVc5dVgyTnZiblJsZUhSY0wycHpiMjV6WTJobGJXRmNMekV0TUMwd0lpd2laR0YwWVNJNmV5SmlkV2xzWkNJNklqYzRNelF0WVc1a2NtVjNYQzlEUVMwek9URTBJaXdpWW5WcGJHUldZWEpwWlc1MElqcHVkV3hzTENKaWRXbHNaRWx6VW1Wc1pXRnpaV1FpT21aaGJITmxMQ0p1WVcxbElqb2lNUzR5TGpFeUlpd2lkbVZ5YzJsdmJpSTZJakV1TWk0eE1pSjlmU3g3SW5OamFHVnRZU0k2SW1sbmJIVTZZMjl0TG5OdWIzZHdiRzkzWVc1aGJIbDBhV056TG5OdWIzZHdiRzkzWEM5dGIySnBiR1ZmWTI5dWRHVjRkRnd2YW5OdmJuTmphR1Z0WVZ3dk1TMHdMVEVpTENKa1lYUmhJanA3SW05elZIbHdaU0k2SW1sdmN5SXNJbTl3Wlc1SlpHWmhJam9pTkRORlFqYzROalF0TWpjeE15MUNNa0ZETFVZM01FUXRSa05GTXpKRE5ETkdNa1UySWl3aWIzTldaWEp6YVc5dUlqb2lPQzR6SWl3aWJtVjBkMjl5YTFSbFkyaHViMnh2WjNraU9pSkRWRkpoWkdsdlFXTmpaWE56VkdWamFHNXZiRzluZVV4VVJTSXNJbUZ3Y0d4bFNXUm1kaUk2SWpVM1JEaEVRVEF6TFVJNU9EY3RORVZFUVMxQ016SXlMVVJDTkRjeE1rRkJNemRDUWlJc0ltTmhjbkpwWlhJaU9pSkJWQ1pVSWl3aVpHVjJhV05sVFdGdWRXWmhZM1IxY21WeUlqb2lRWEJ3YkdVZ1NXNWpMaUlzSW01bGRIZHZjbXRVZVhCbElqb2lkMmxtYVNJc0ltUmxkbWxqWlUxdlpHVnNJam9pYVZCaFpDSjlmU3g3SW5OamFHVnRZU0k2SW1sbmJIVTZZMjl0TG5OdWIzZHdiRzkzWVc1aGJIbDBhV056TG5OdWIzZHdiRzkzWEM5amJHbGxiblJmYzJWemMybHZibHd2YW5OdmJuTmphR1Z0WVZ3dk1TMHdMVEFpTENKa1lYUmhJanA3SW5CeVpYWnBiM1Z6VTJWemMybHZia2xrSWpvaVl6WXdZekU0TXpRdE9UaG1aaTAwTXpjMExXSTRNRGd0T0RkbU5ERmpOVE0yTVRZMElpd2ljMlZ6YzJsdmJrbGtJam9pTkdOaE1tUTRZVFV0Wm1RMFlTMDBaRGcxTFRsaU1tSXRaams0T1RFMk5HRTRZemMwSWl3aWRYTmxja2xrSWpvaVlqSXlaak14WVdNdE5qWTFNaTAwWlRFNExXSmhNRFV0TW1Wa09UQXhNbVJqWkdZNUlpd2ljMlZ6YzJsdmJrbHVaR1Y0SWpvekxDSnpkRzl5WVdkbFRXVmphR0Z1YVhOdElqb2lVMUZNU1ZSRkluMTlYWDAiLCJzdG0iOiIxNDU2OTM0MTUxNzM4IiwiZHRtIjoiMTQ1NjkzNDEyMzc3NyIsInR2IjoiaW9zLTAuNS4yIiwidG5hIjoic3RhZ2UiLCJ1ZV9weCI6ImV5SnpZMmhsYldFaU9pSnBaMngxT21OdmJTNXpibTkzY0d4dmQyRnVZV3g1ZEdsamN5NXpibTkzY0d4dmQxd3ZkVzV6ZEhKMVkzUmZaWFpsYm5SY0wycHpiMjV6WTJobGJXRmNMekV0TUMwd0lpd2laR0YwWVNJNmV5SnpZMmhsYldFaU9pSnBaMngxT21OdmJTNXpibTkzY0d4dmQyRnVZV3g1ZEdsamN5NXpibTkzY0d4dmQxd3ZjMk55WldWdVgzWnBaWGRjTDJwemIyNXpZMmhsYldGY0x6RXRNQzB3SWl3aVpHRjBZU0k2ZXlKdVlXMWxJam9pVFdGcGJsWnBaWGNpZlgxOSIsImUiOiJ1ZSIsImxhbmciOiJlbiIsImR1aWQiOiI1N0Q4REEwMy1COTg3LTRFREEtQjMyMi1EQjQ3MTJBQTM3QkIiLCJhaWQiOiJjYW5hcnkyMDE1MTExOSIsInJlcyI6IjY0MHg5NjAifV19", "errors": [ { "level": "error", "message": "error: object instance has properties which are not allowed by the schema: ["buildIsReleased","buildVarient"]n level: "error"n schema: {"loadingURI":"#","pointer":""}n instance: {"pointer":""}n domain: "validation"n keyword: "additionalProperties"n unwanted: ["buildIsReleased","buildVarient"]n" } ], "failure_tstamp": "2016-03-03T01:19:36.643Z" }, "fields": { "failure_tstamp": [ 1456967976643 ] }, "sort": [ 1456967976643 ] }
The above error message is caused by a failure to validate data against the associated schema. Specifically, a two fields have been included in a JSON sent into Snowplow that are not allowed:
buildIsReleased, andbuildVarient
2. Identify how many bad rows are caused by this error
Now we’ve identified a tracker error, we want to understand how prevalent this is. We can do that by simply updating our Kibana query to return rows with this type of error message i.e.
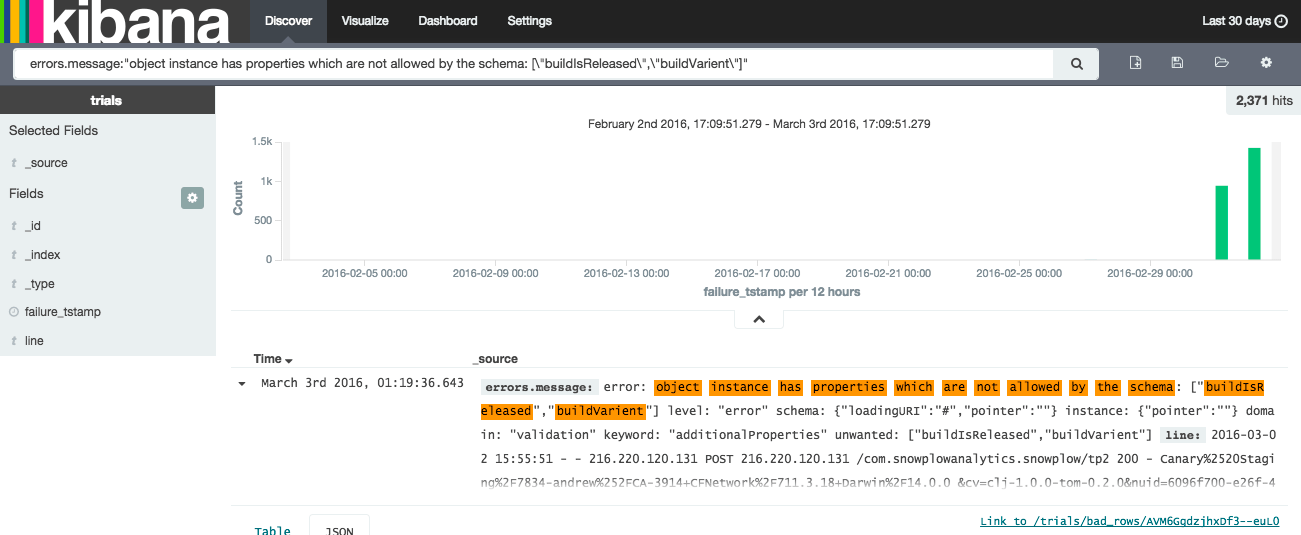
errors.message:"object instance has properties which are not allowed by the schema: ["buildIsReleased","buildVarient"]"In our case, we can see that this error was only introduced yesterday, but that since then it accounts for almost 2500 bad rows:

Addressing this issue is essential. Fortunately, this should be straightforward: most likely we need to create a new version of the schema that allows for the two fields, and update the tracker code to send in a reference to the new schema version in the different self-describing JSONs.
3. Filter out those bad rows and repeat
Now we’ve dealt with the first source of bad rows, let’s identify the second. This is easy, we update our Kibana query to filter out the bad rows we were exploring above:
-errors.message:"object instance has properties which are not allowed by the schema: ["buildIsReleased","buildVarient"]"and in addition filter out the bad rows that we did not need to worry about:
-errors.message:"object instance has properties which are not allowed by the schema: ["buildIsReleased","buildVarient"]" AND -errors.message:"does not match (/)vendor/version(/) pattern nor is a legacy /i(ce.png) request" AND -errors.message:"Unrecognized event [null]"We repeat the above process until all the sources of bad data have been identified and dealt with!
Further reading
- We need to talk about bad data, our blog post explaining why we have to confront and manage bad data, rather than pretending it does not exist
- Snowplow R73 release with support for loading bad data into Elasticsearch

